Dashboard UI Guide
The EverTask dashboard is a React interface for monitoring task execution, debugging failures, and spotting performance patterns.
Note: The dashboard itself is read-only. You can view, analyze, filter and export all task data; requeue, resume and cancel are exposed by the API’s management endpoints (opt-in and behind their own role) and not yet by a button here. From application code, changing a schedule is
ITaskScheduleManager, behind your own authorization.
Quick Access:
URL: http://localhost:5000/evertask-monitoring
Default Credentials: admin / admin
What You Can Do
The dashboard helps you answer the questions you actually have about your background tasks:
- “What’s happening right now?” - See tasks in progress, recent completions, and failures in real-time
- “Why did this task fail?” - Drill into execution logs with full stack traces and structured logging
- “Is my system healthy?” - Monitor success rates, execution times, and queue metrics at a glance
- “Which tasks are slow?” - Analyze performance trends and identify bottlenecks
- “How reliable are my recurring tasks?” - Track execution history across all attempts
- “What did that outage cost me?” - See the occurrences a durable schedule still owes, how far behind it is, and whether a catch-up stopped itself
Main Views
Overview Dashboard
Your starting point shows the big picture: total tasks, success rates, active queues, and average execution times. Time-based charts help you spot trends (hourly spikes, daily patterns, weekly anomalies). Queue cards give you instant health checks with color-coded success rates (green = healthy, yellow = watch, red = investigate).
The Recent Activity feed shows the last 50 events as they happen, so you can watch tasks flow through the system in real-time.
When any schedule runs with durable occurrences, a Durable Occurrences card appears with the whole backlog by state (pending, active, failed, skipped, completed), the oldest slot that has not started yet, and how far behind it is. A schedule whose catch-up halted itself over its overflow cap is called out there too, because a halt never releases itself: someone has to resume or reschedule the series.
Task List & Filtering
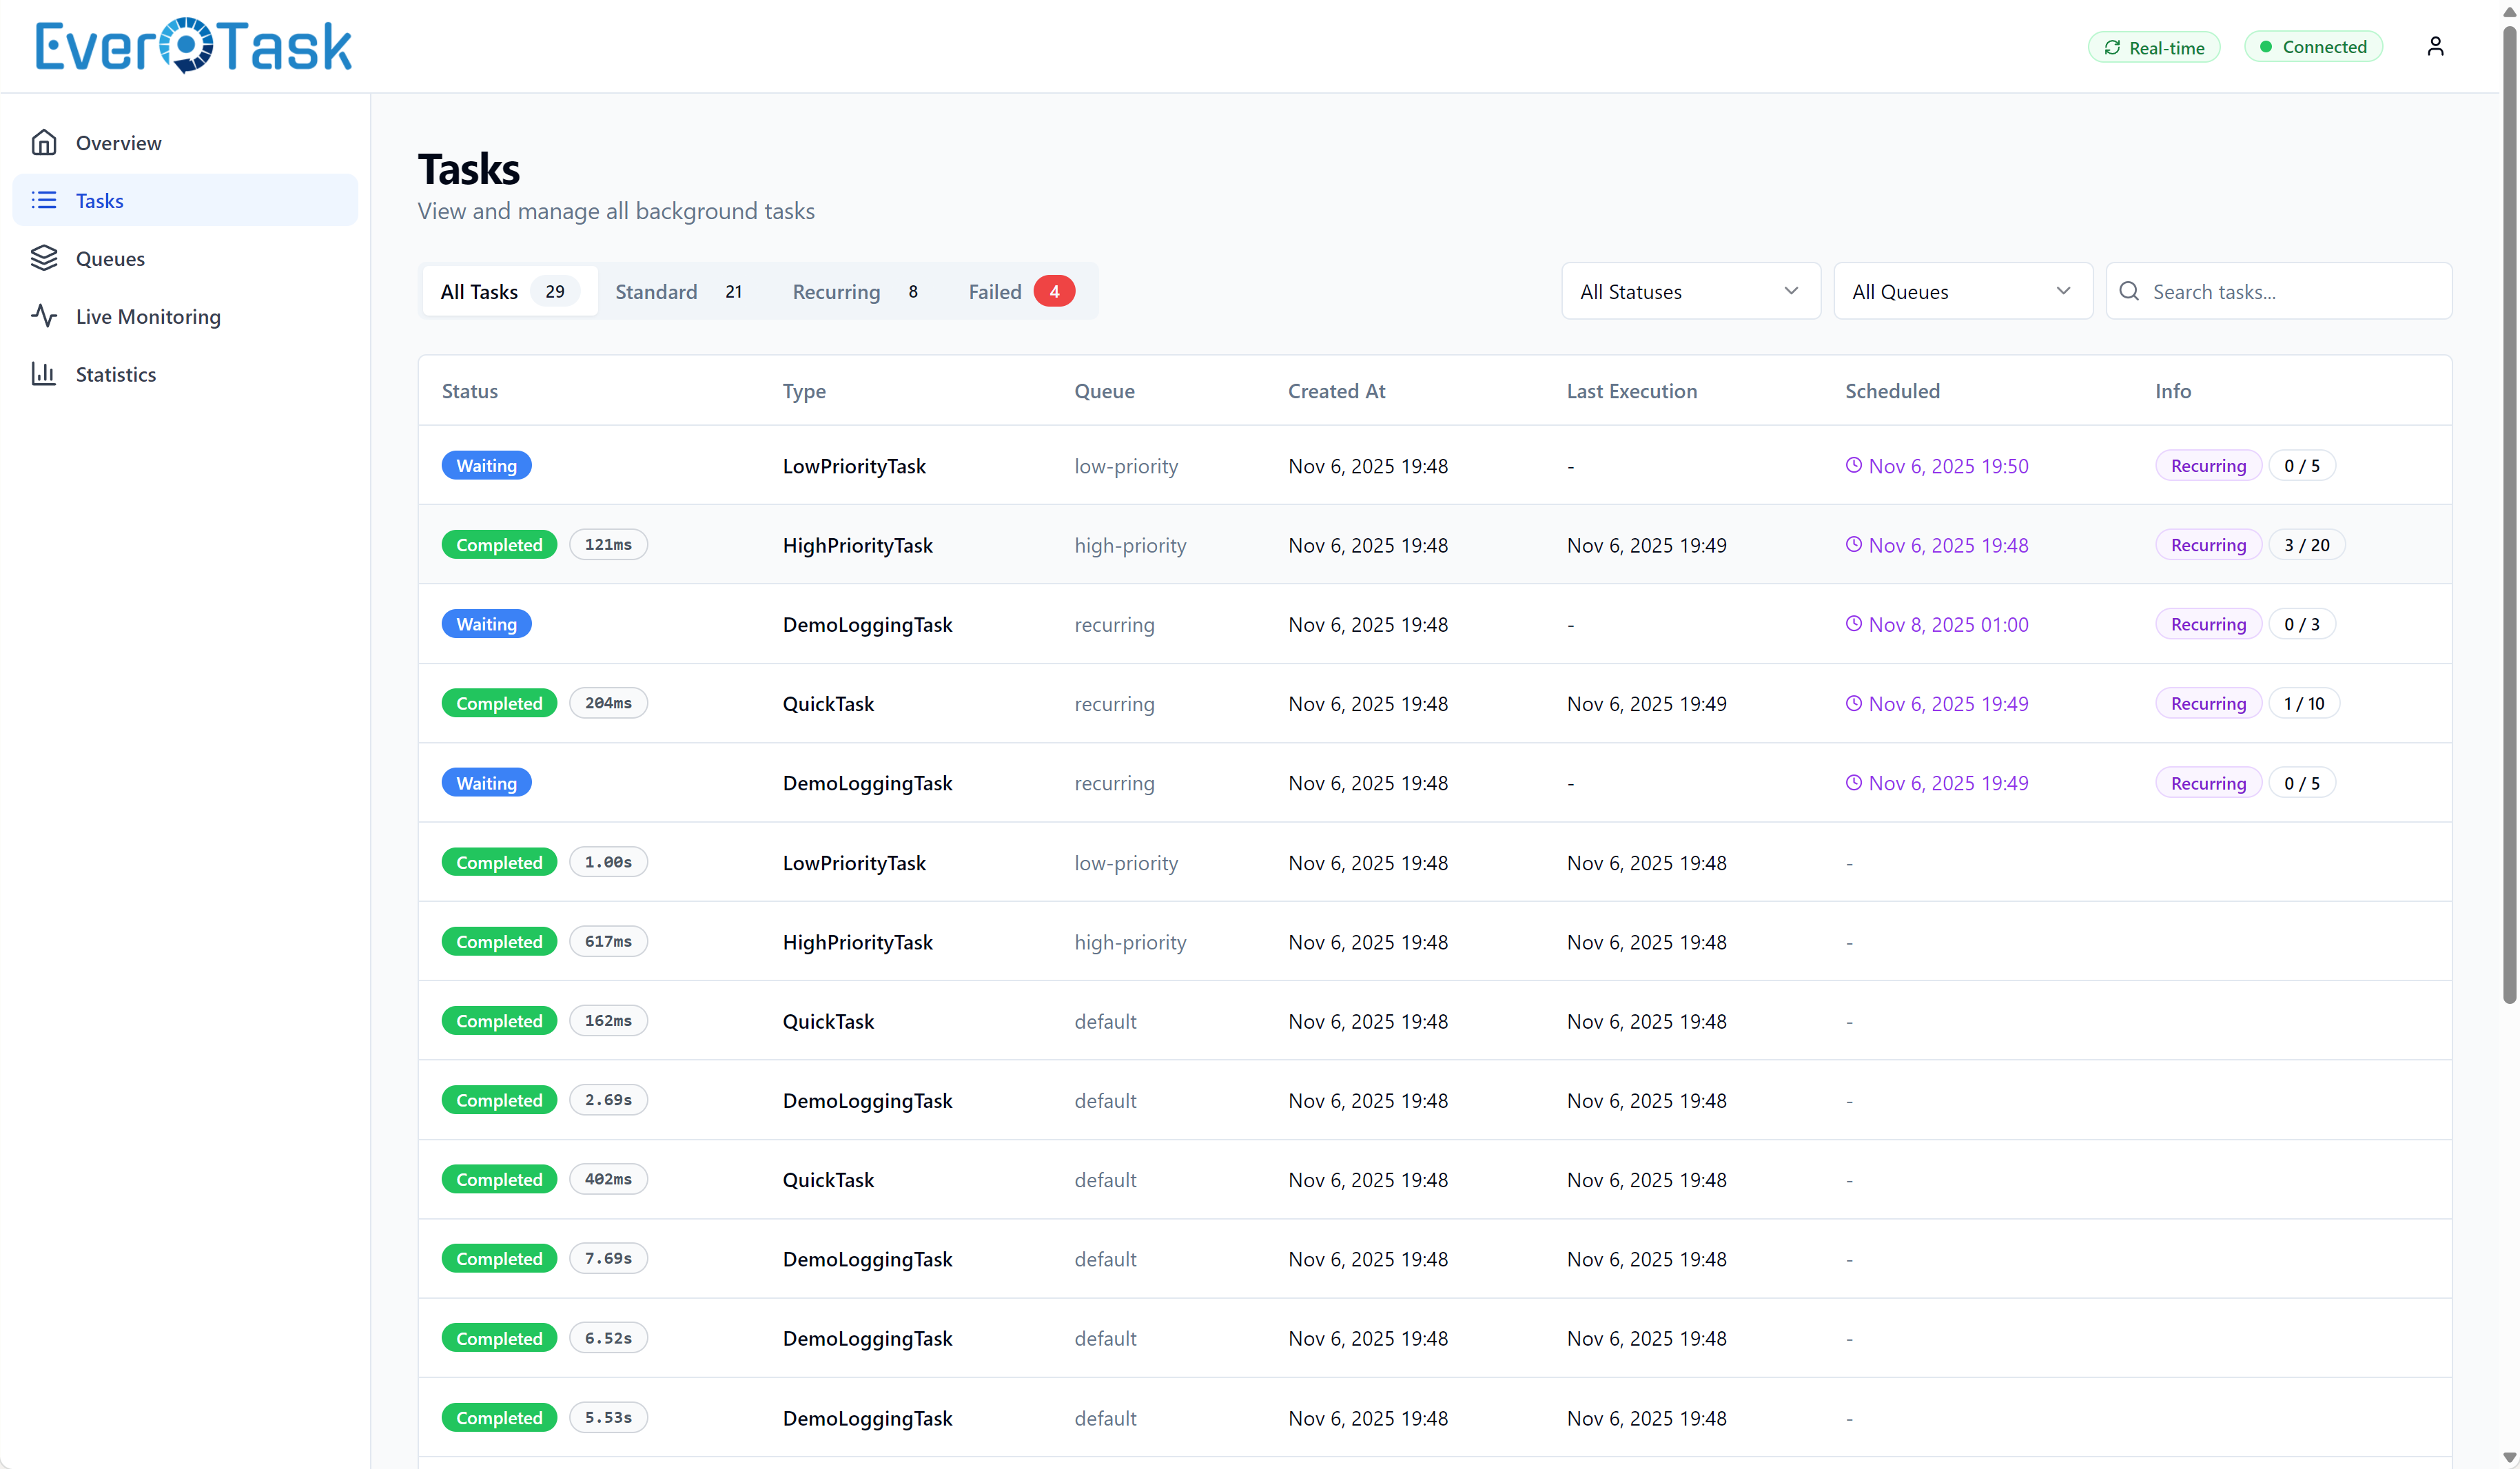
Filter tasks by status (Queued, In Progress, Completed, Failed, Cancelled), queue name, task type, or date range. Combine filters to narrow down exactly what you need: “Show me all failed payment tasks from yesterday in the critical queue.”
Search is instant and works across task IDs, types, and parameters. Pagination keeps things fast even with millions of tasks in storage.
Occurrences of a durable schedule are tasks like any other, so they show up in the list with an Occurrence badge, a Catch-up or Fire once badge when they stand for missed work, and how late they started against their nominal slot. The API filters behind them (onlyOccurrences, onlyCatchUp, parentTaskId) are documented in the API Reference.
Task Details
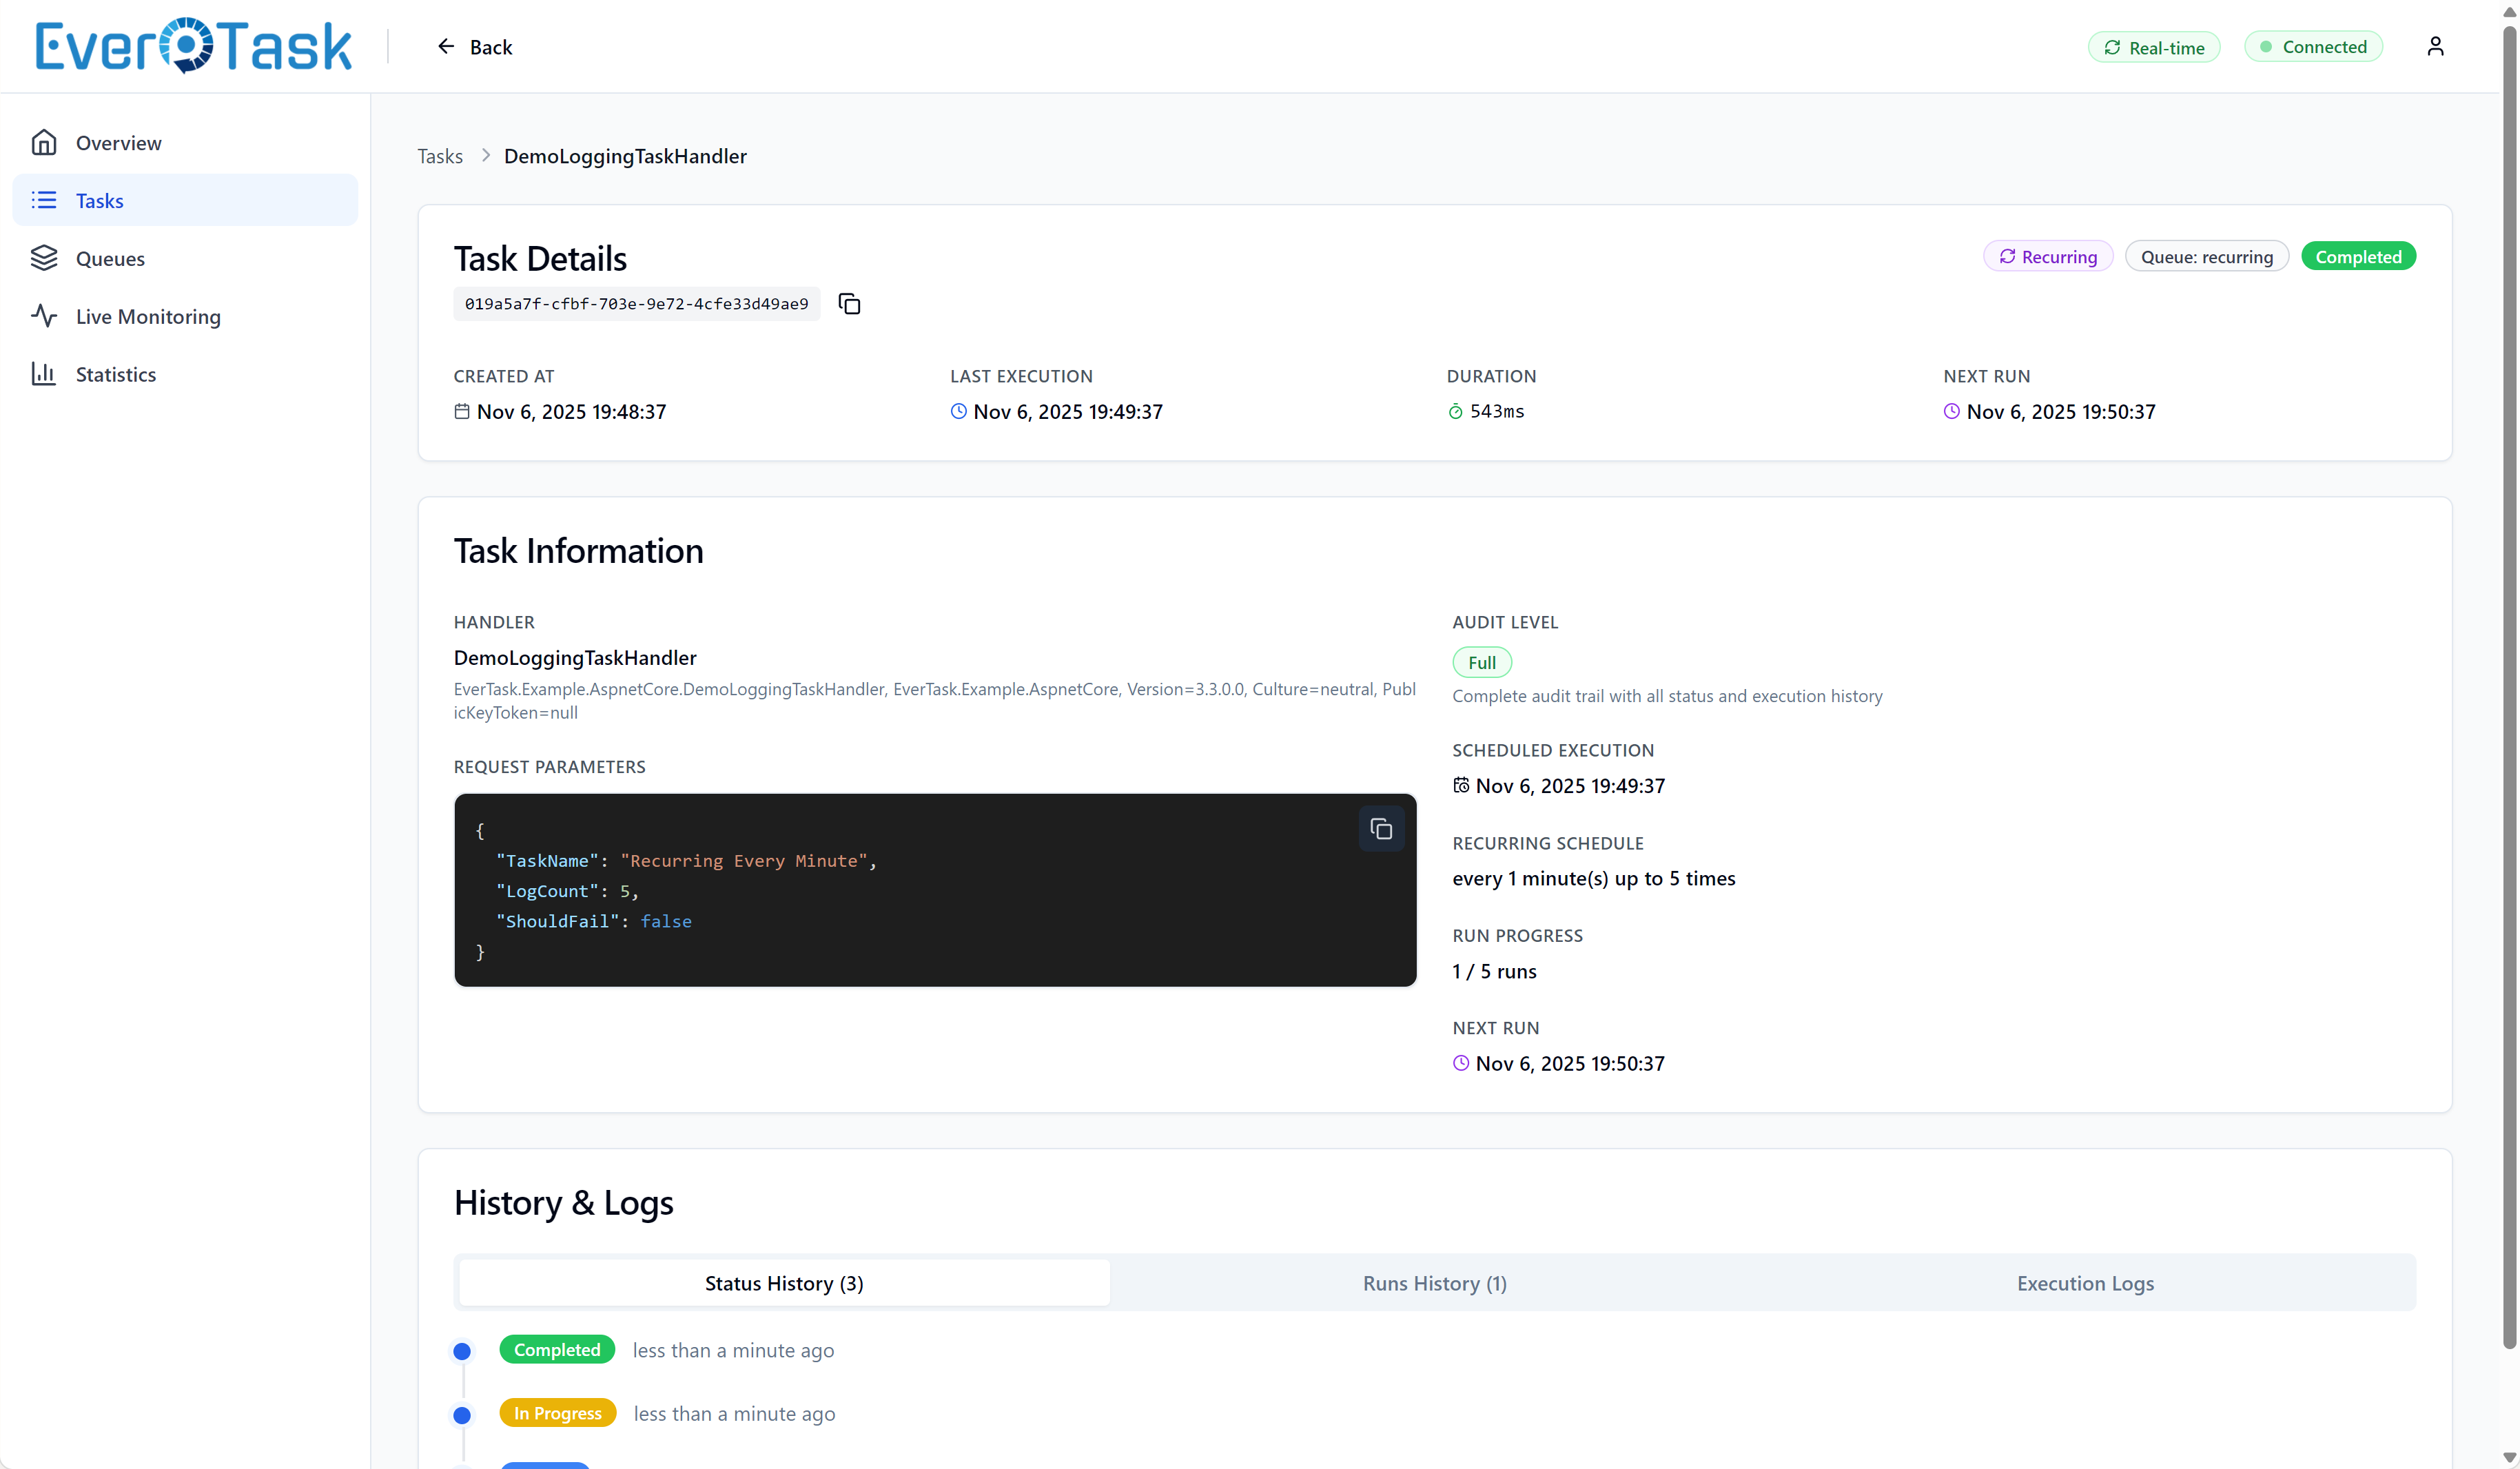
Click any task to see everything about its lifecycle. The modal view has three tabs, four on a durable schedule:
Status History shows every state transition (Queued → InProgress → Completed/Failed) with timestamps. Perfect for understanding “when did this task actually start?” or “how long was it queued?”
Execution History matters most for recurring tasks. See all execution attempts, their durations, and outcomes. Quickly spot if a recurring task that usually takes 2 seconds suddenly took 30 seconds on the last run.
Occurrences appears on a durable schedule row only. It lists the rows that schedule materialized, newest slot first, with the run number each of them is, the misfire it stands for, and how late it started. A hundred at a time, with Previous and Next. The storage hands over one page: a schedule with a year of retention behind it holds far more rows than a tab can show. Each line opens that occurrence’s own detail page. It is a task row, so it has its own audits and logs.
A schedule row also carries what its definition says: the occurrence mode, the misfire policy, the time zone its calendar is read on, and the schedule version, which changes every time the schedule is rescheduled at runtime. An occurrence carries the other half: the schedule it belongs to, its nominal slot, and the range of missed slots it was created out of.
Execution Logs is where you actually debug. If you enabled persistent logging, you’ll see a terminal-style viewer with color-coded log levels (Info in blue, Warnings in yellow, Errors in red). Stack traces get syntax highlighting, and you can export logs to JSON/CSV for deeper analysis.
Queue Metrics
Each queue gets its own card showing task distribution (how many queued, running, completed, failed). Success rate percentages with color indicators help you spot troubled queues instantly. Click a queue card to filter the task list to that queue’s tasks.
This is where multi-queue setups pay off: you can see at a glance if your “critical” queue is healthy while your “background” queue has some failures that need investigation.
Analytics & Trends
The Statistics page helps you understand patterns over time. Success rate trends show if your system is getting more stable or degrading. Task type distribution reveals which handlers run most frequently (maybe you didn’t realize your health check runs 10,000 times a day).
Execution time analysis is where you find performance bottlenecks. A sortable table shows average, min, and max execution times per task type. Color-coded indicators highlight slow tasks (>5s average = red flag). This helps you prioritize optimization efforts: “Our email task averages 8 seconds, but our payment task averages 50ms: time to optimize emails.”
Real-Time Updates
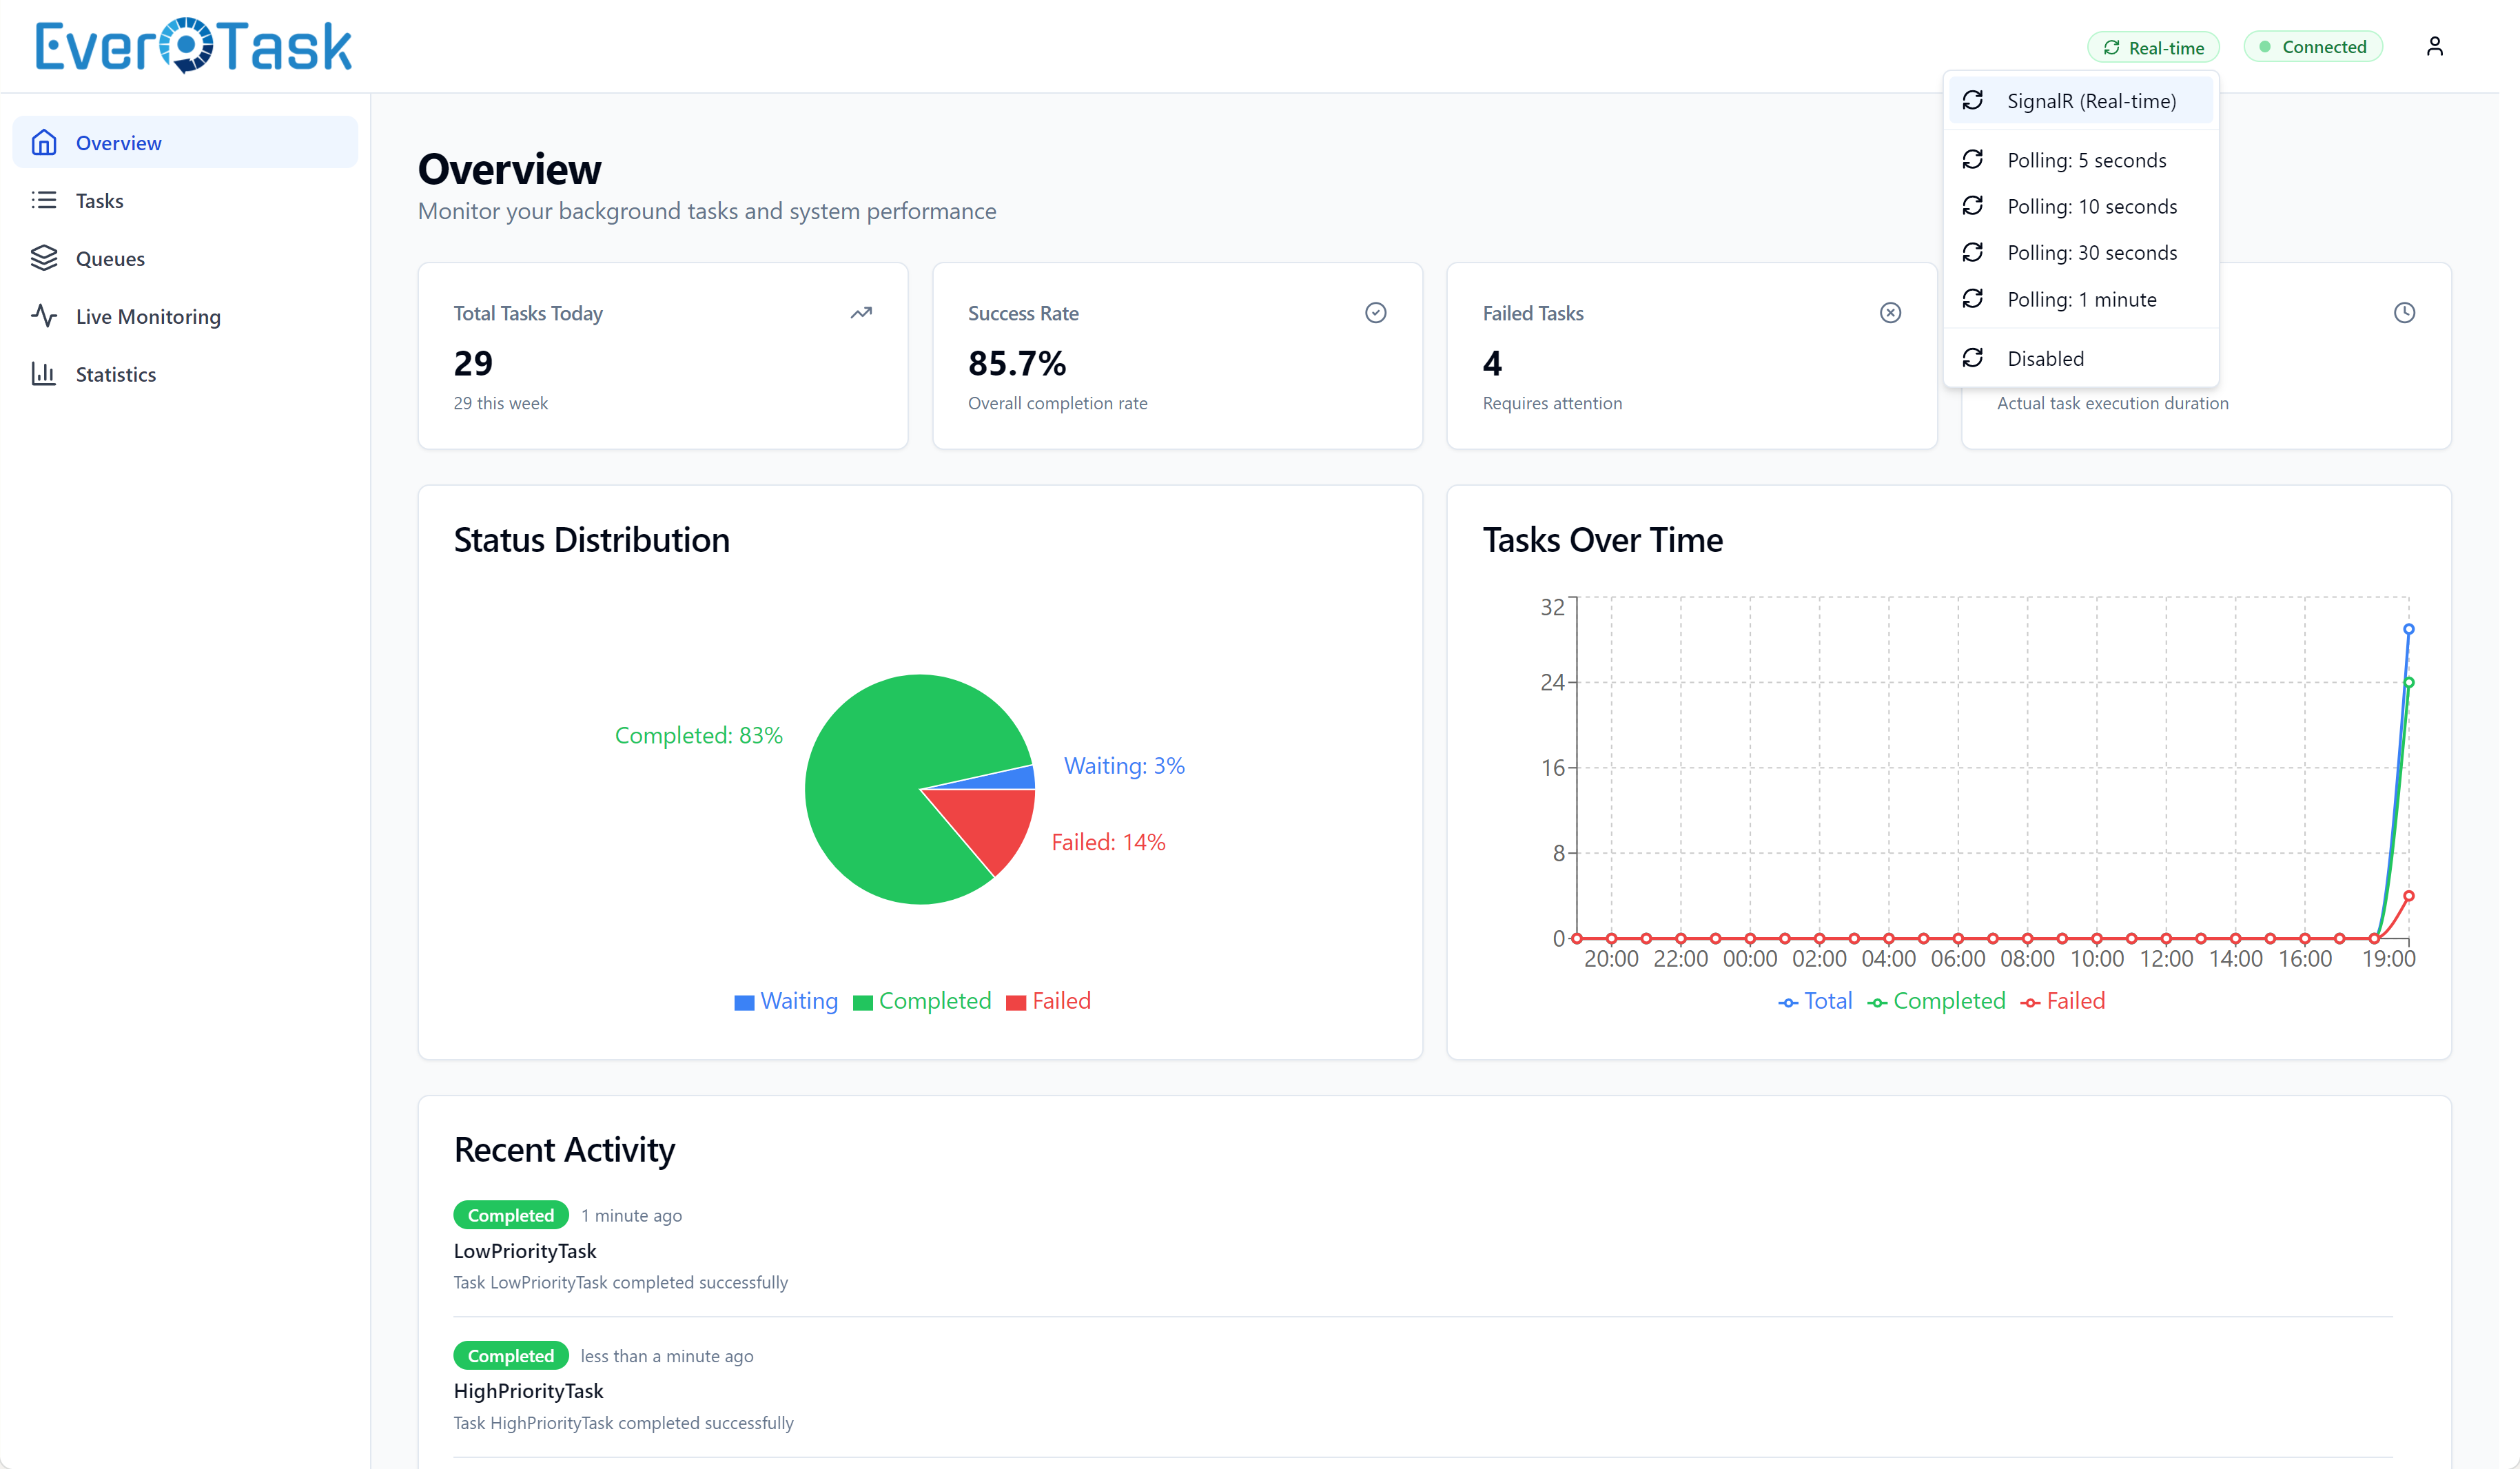
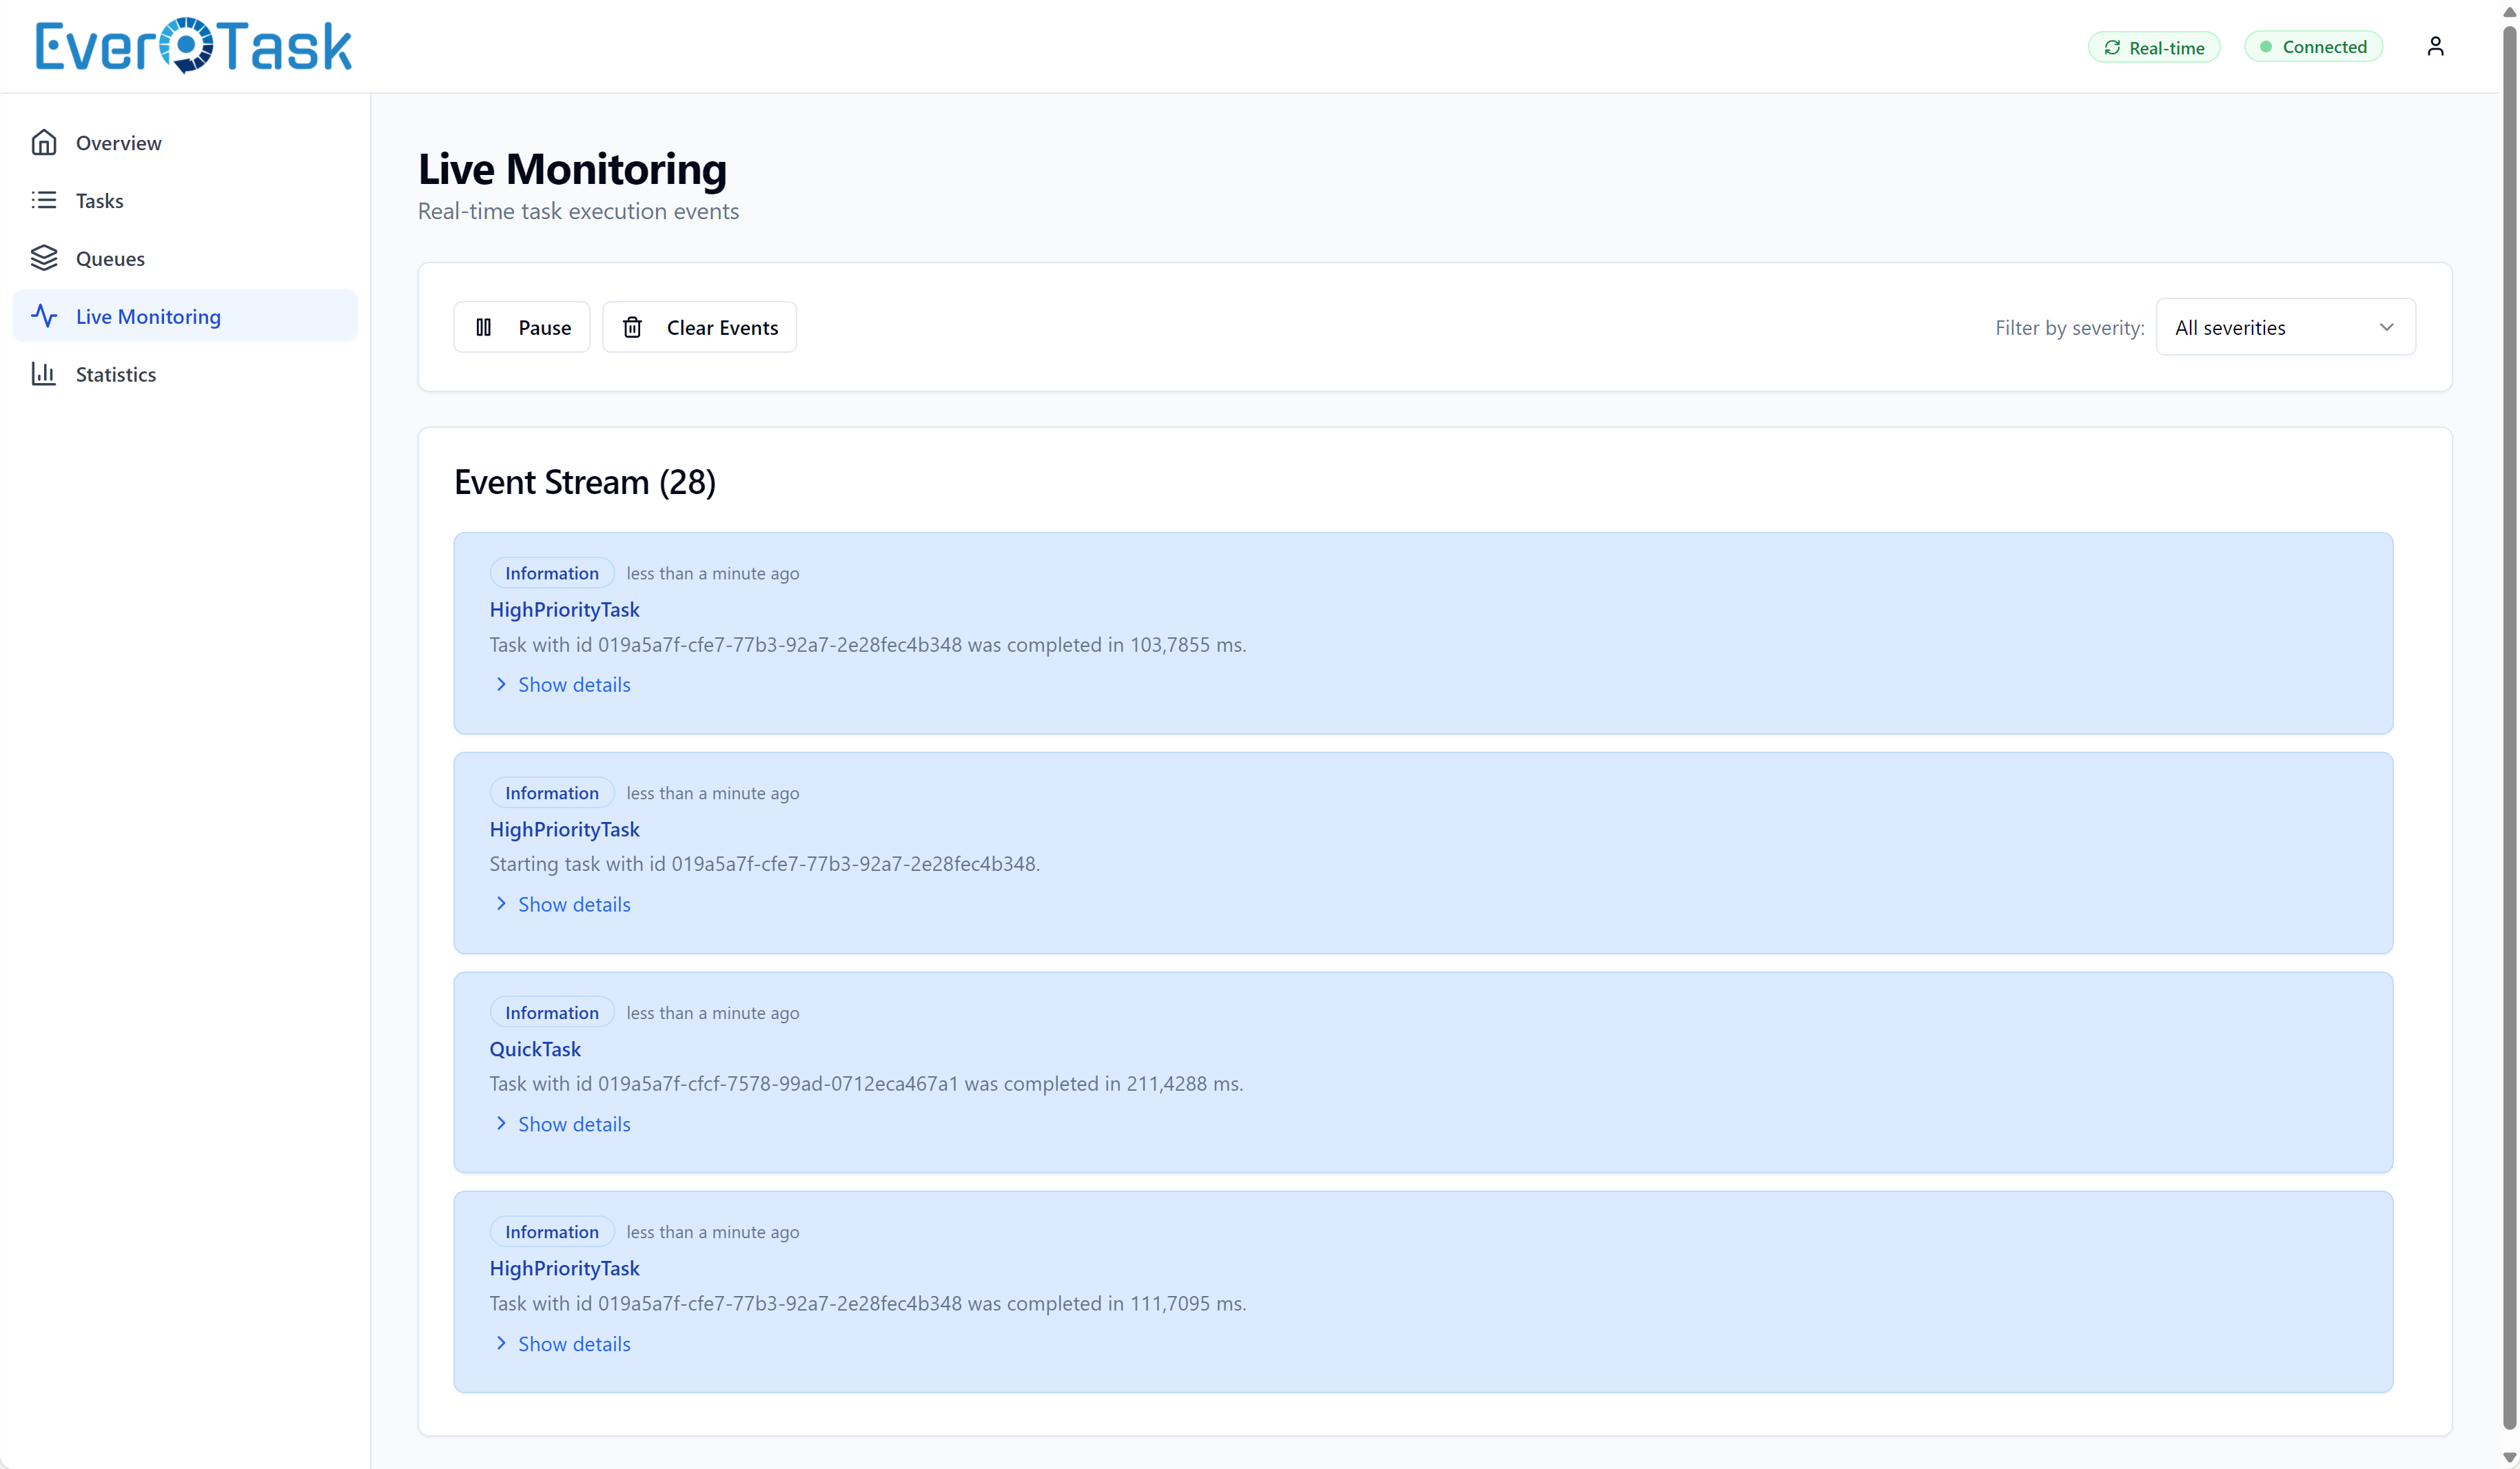
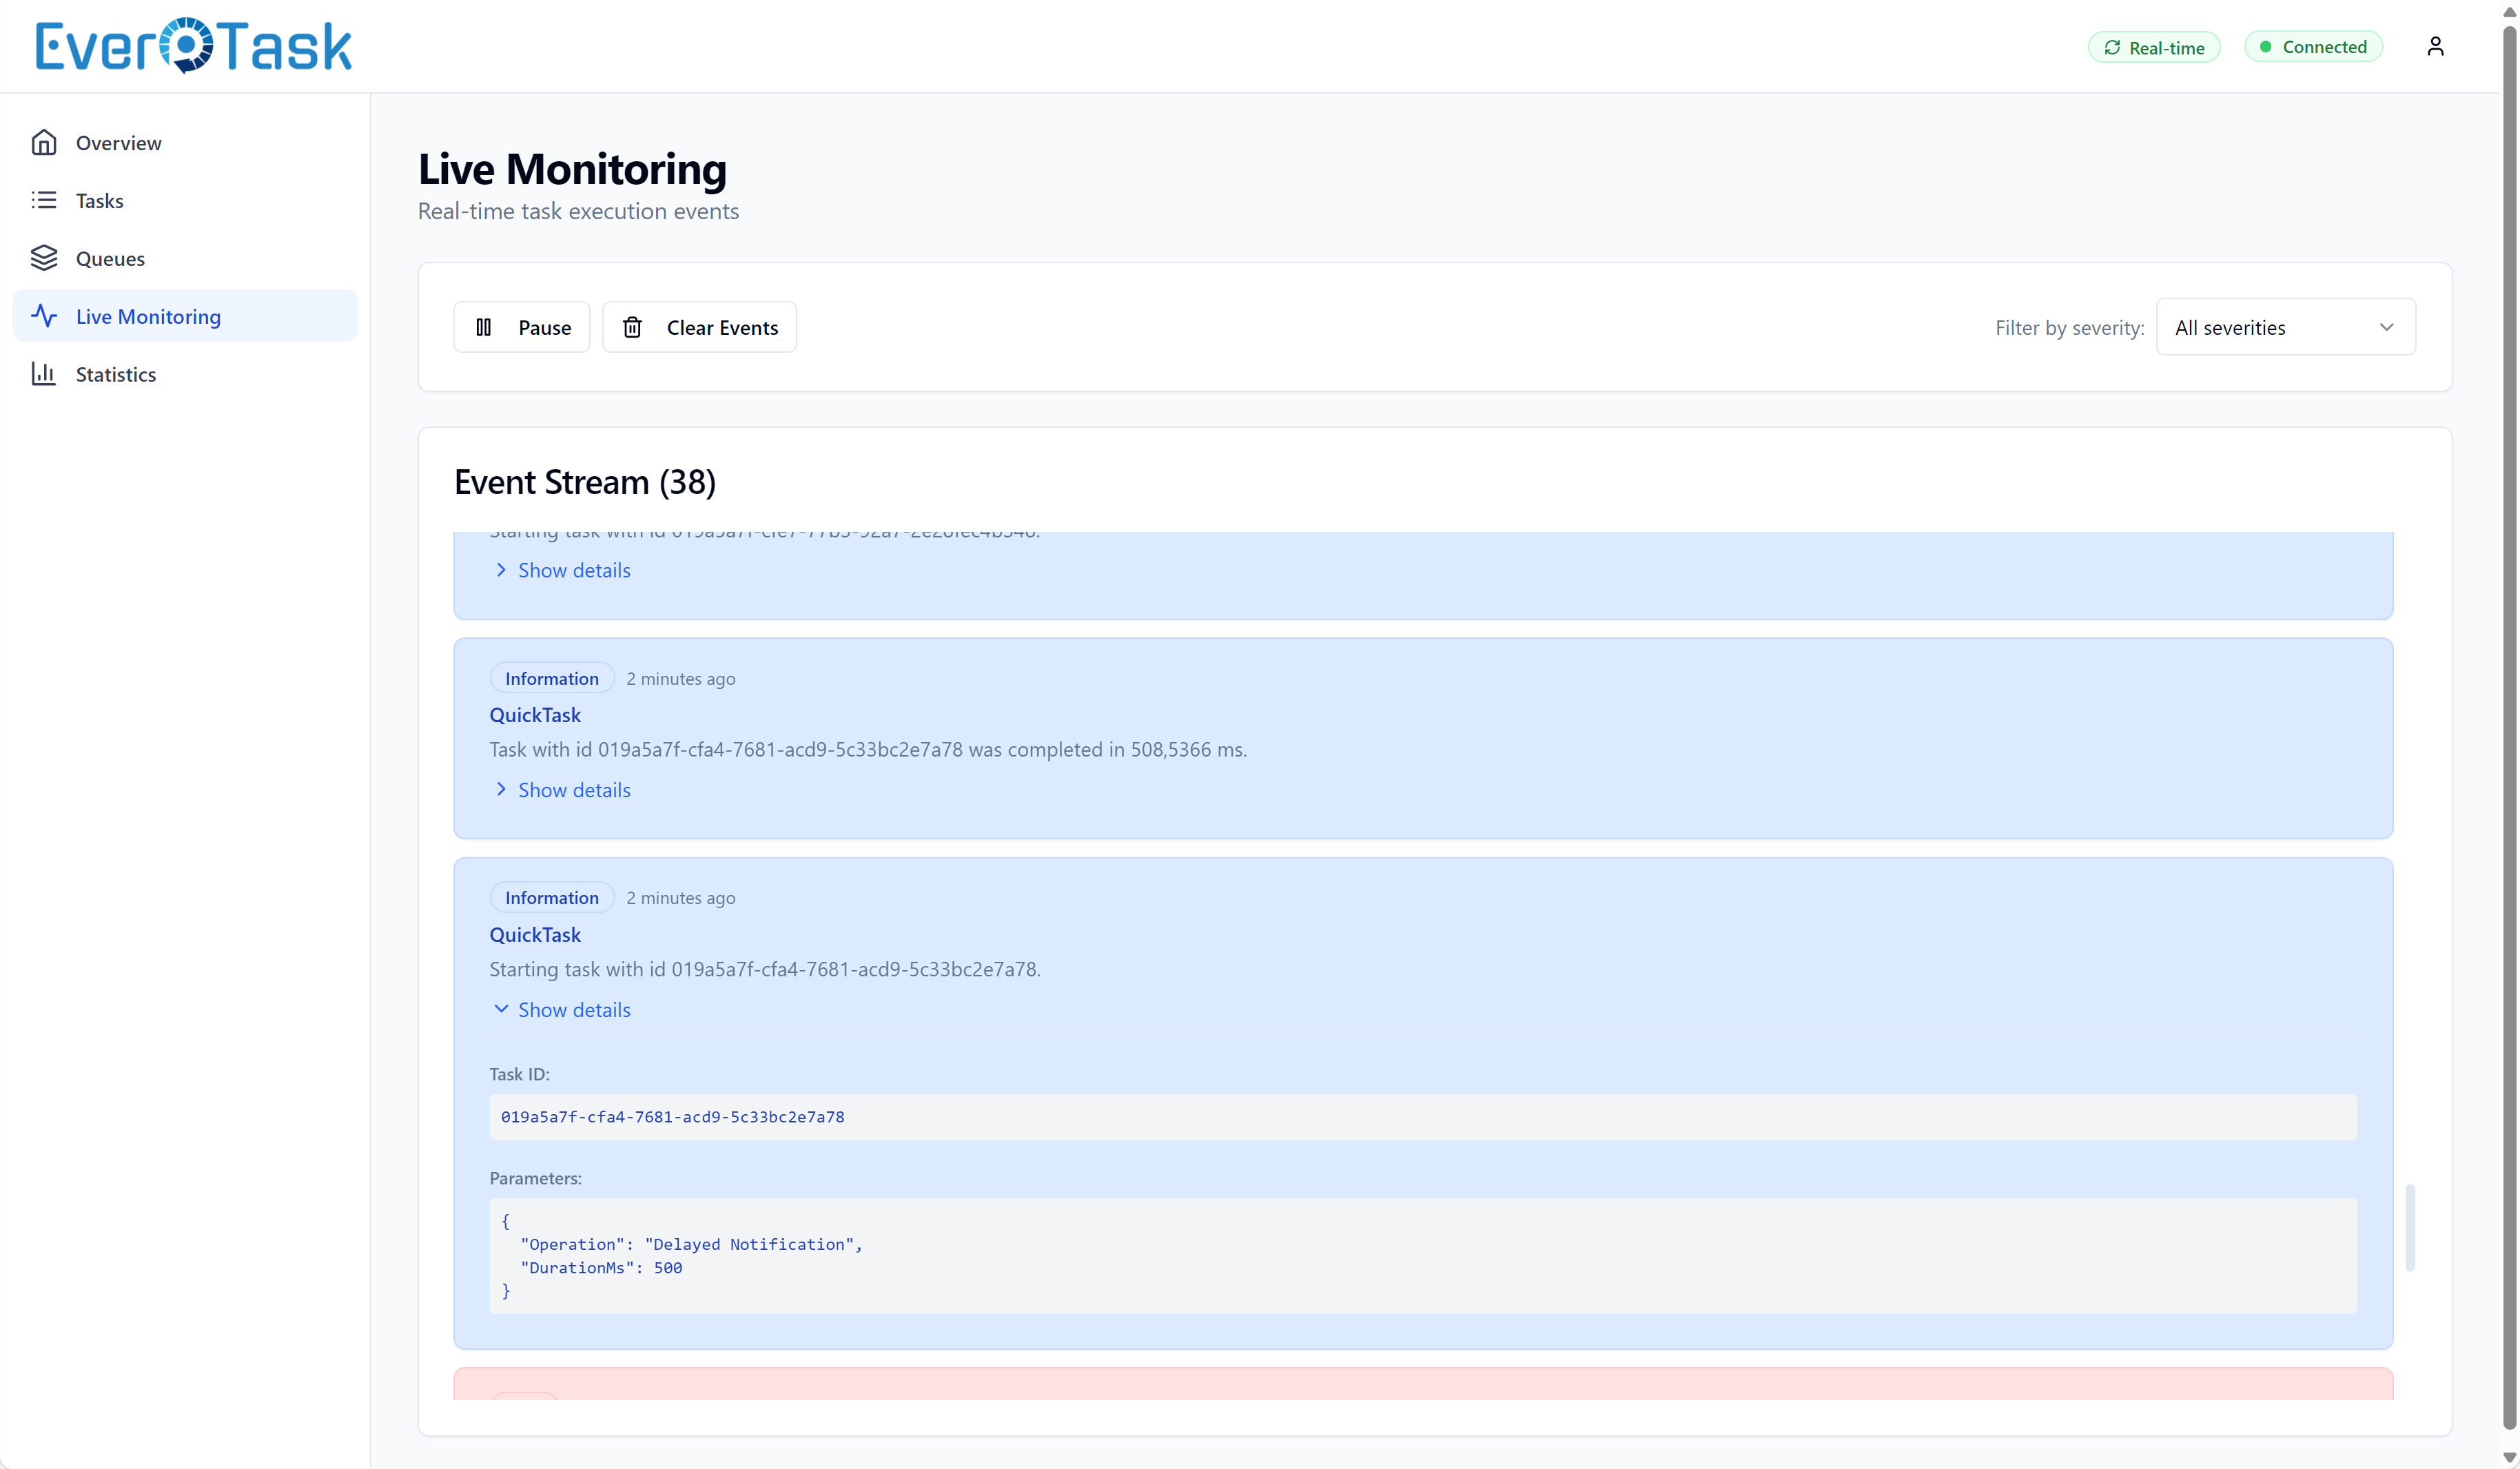
The dashboard uses SignalR for real-time updates. Instead of polling every few seconds (which wastes bandwidth and hammers your API), the dashboard only refreshes when something actually changes.
How It Works:
When a task completes, fails, or changes status, EverTask broadcasts a SignalR event. The dashboard receives the event and invalidates its cache, triggering a fresh data fetch. Multiple rapid events (like during a task burst) are debounced to prevent API spam: if 100 tasks complete in 2 seconds, you get one refresh, not 100.
Configure Responsiveness:
.AddMonitoringApi(options =>
{
    options.EventDebounceMs = 1000;  // Wait 1 second before refreshing (default)
    // 300ms: Very responsive (low-volume)
    // 500ms: Balanced (moderate responsiveness)
    // 1000ms: Conservative (high-volume, best performance)
});
Connection Status:
The header shows your SignalR connection status with color-coded indicators (green = connected, yellow = connecting, red = disconnected). If SignalR drops, the dashboard automatically falls back to polling every 30 seconds. You can force a refresh anytime with the refresh button.
That keeps network traffic down without leaving the UI on stale data between polls.
Screenshots
See the dashboard in action across these 10 screenshots:
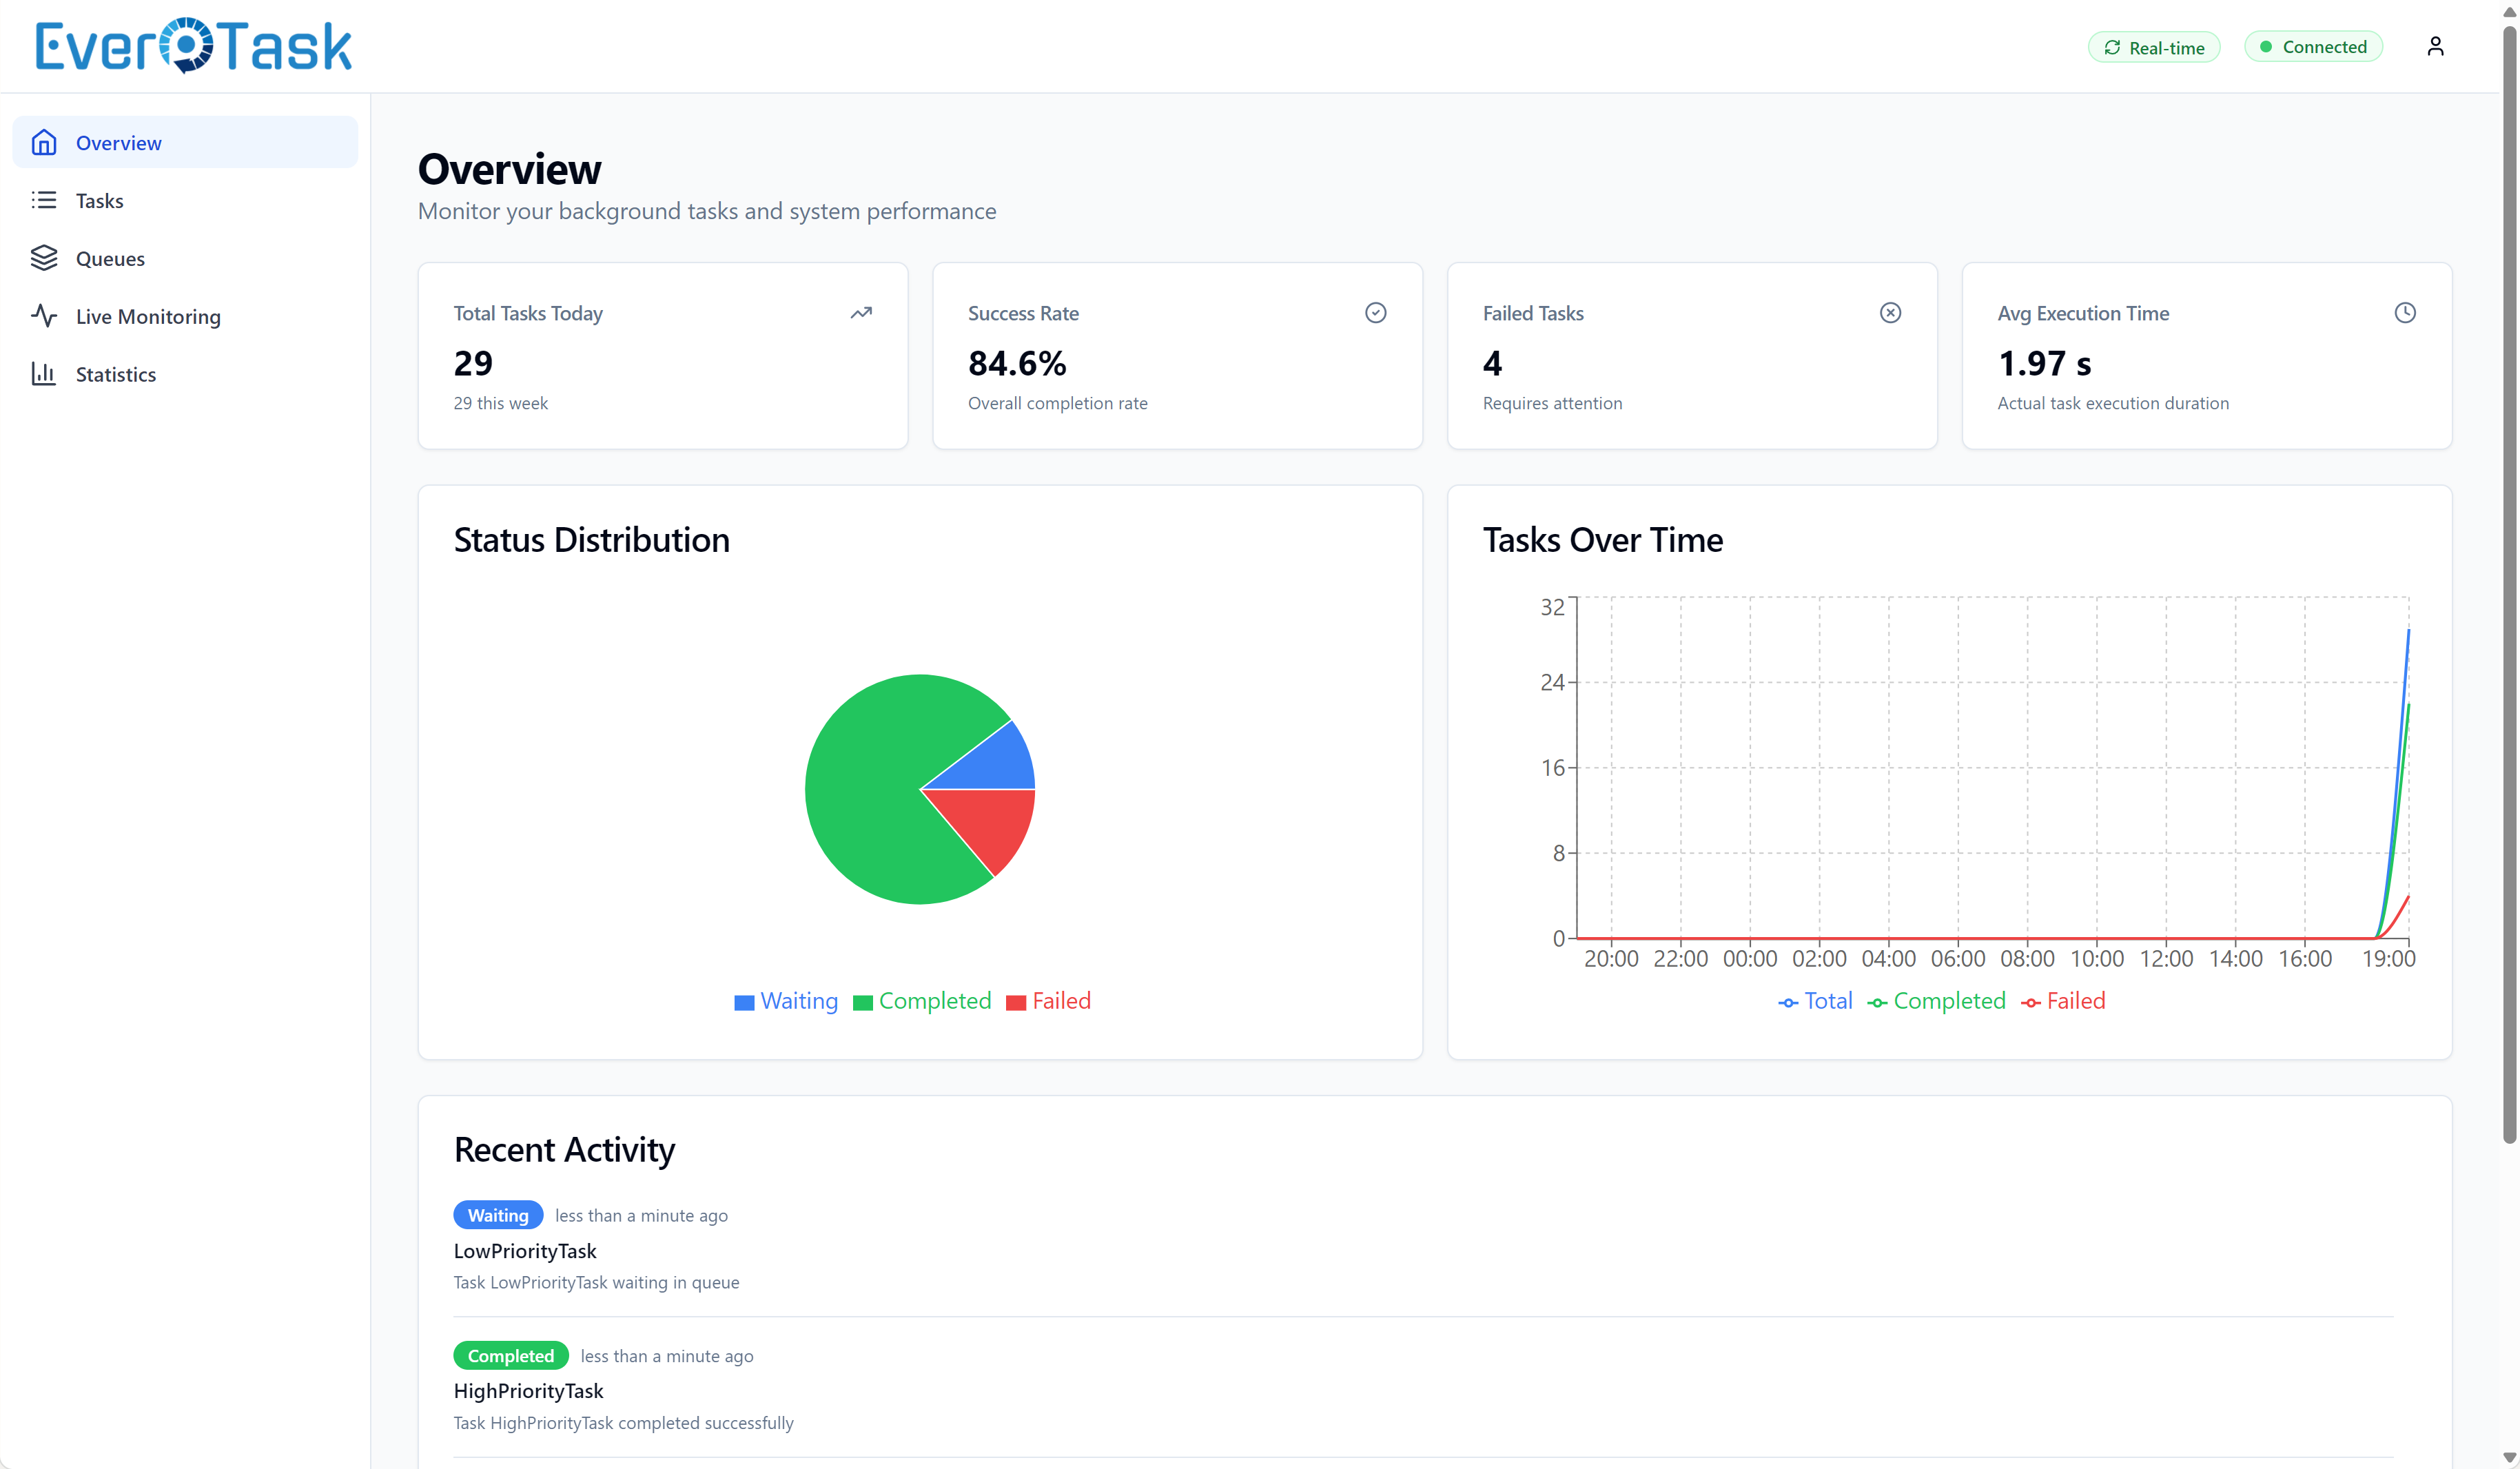
Overview dashboard with real-time metrics and activity charts
Task list with advanced filtering and search
Task detail modal with parameters and execution info
Terminal-style execution logs with color-coded severity
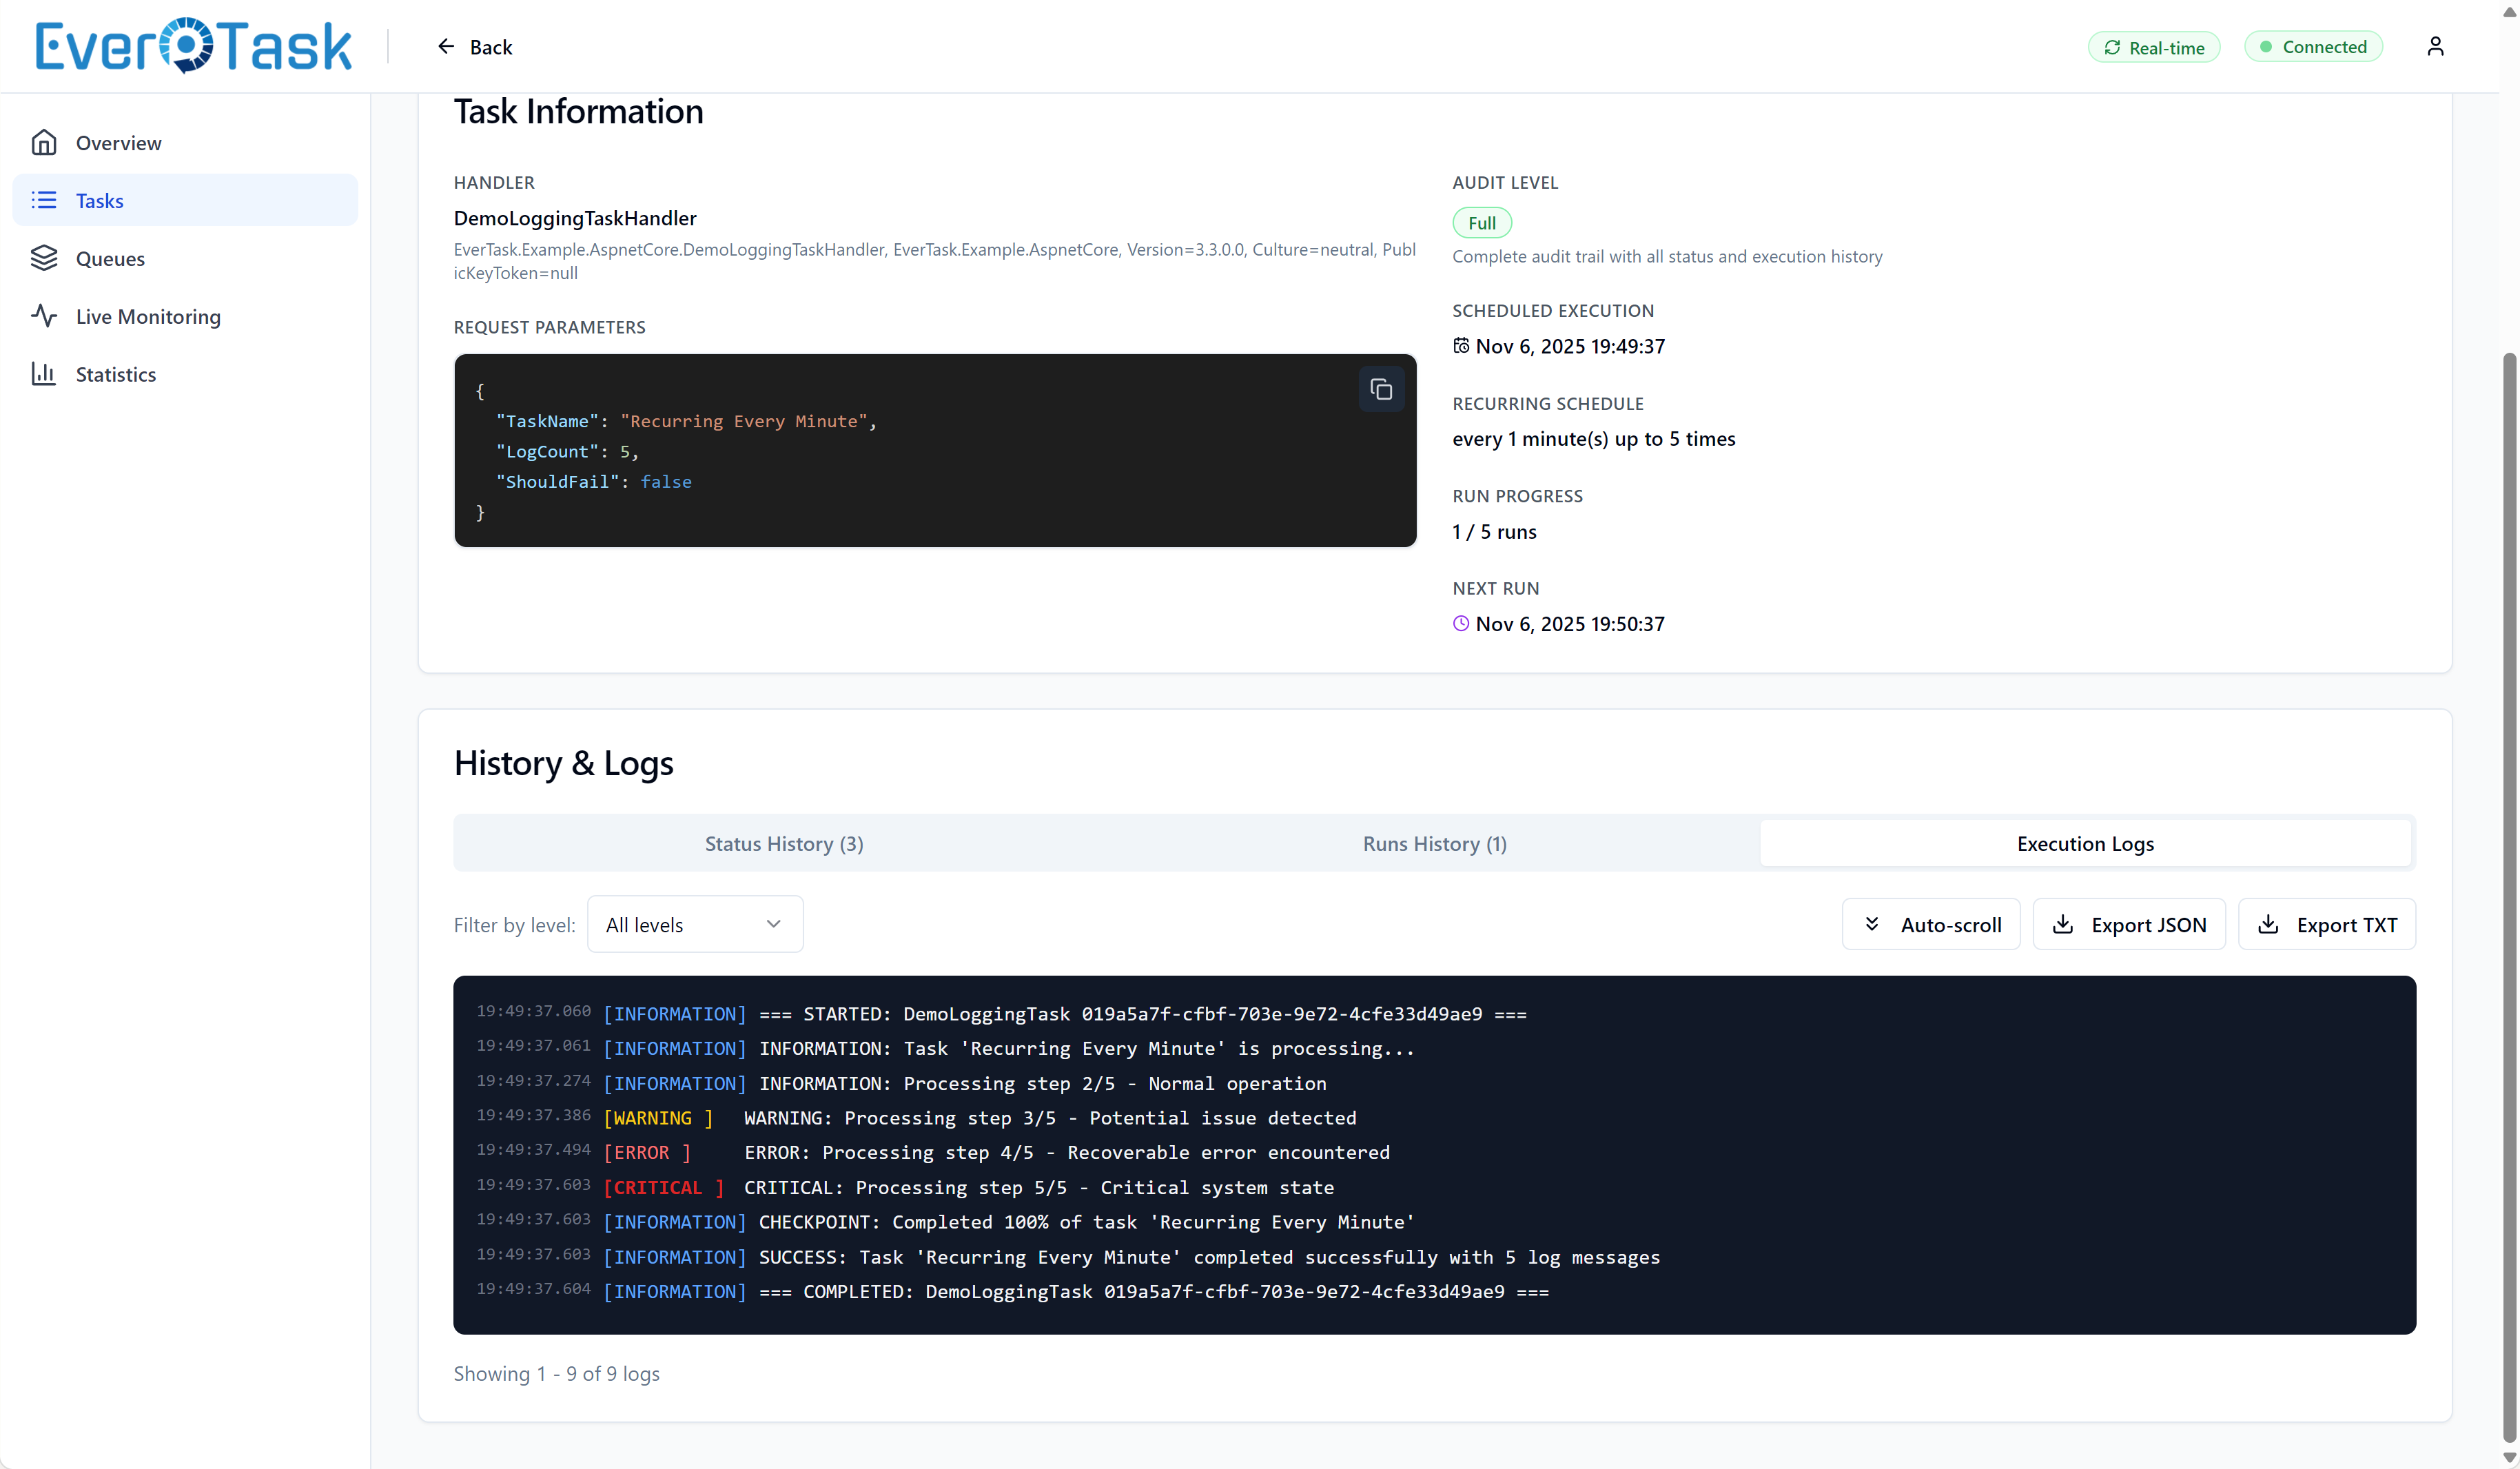
Complete audit trail of status transitions
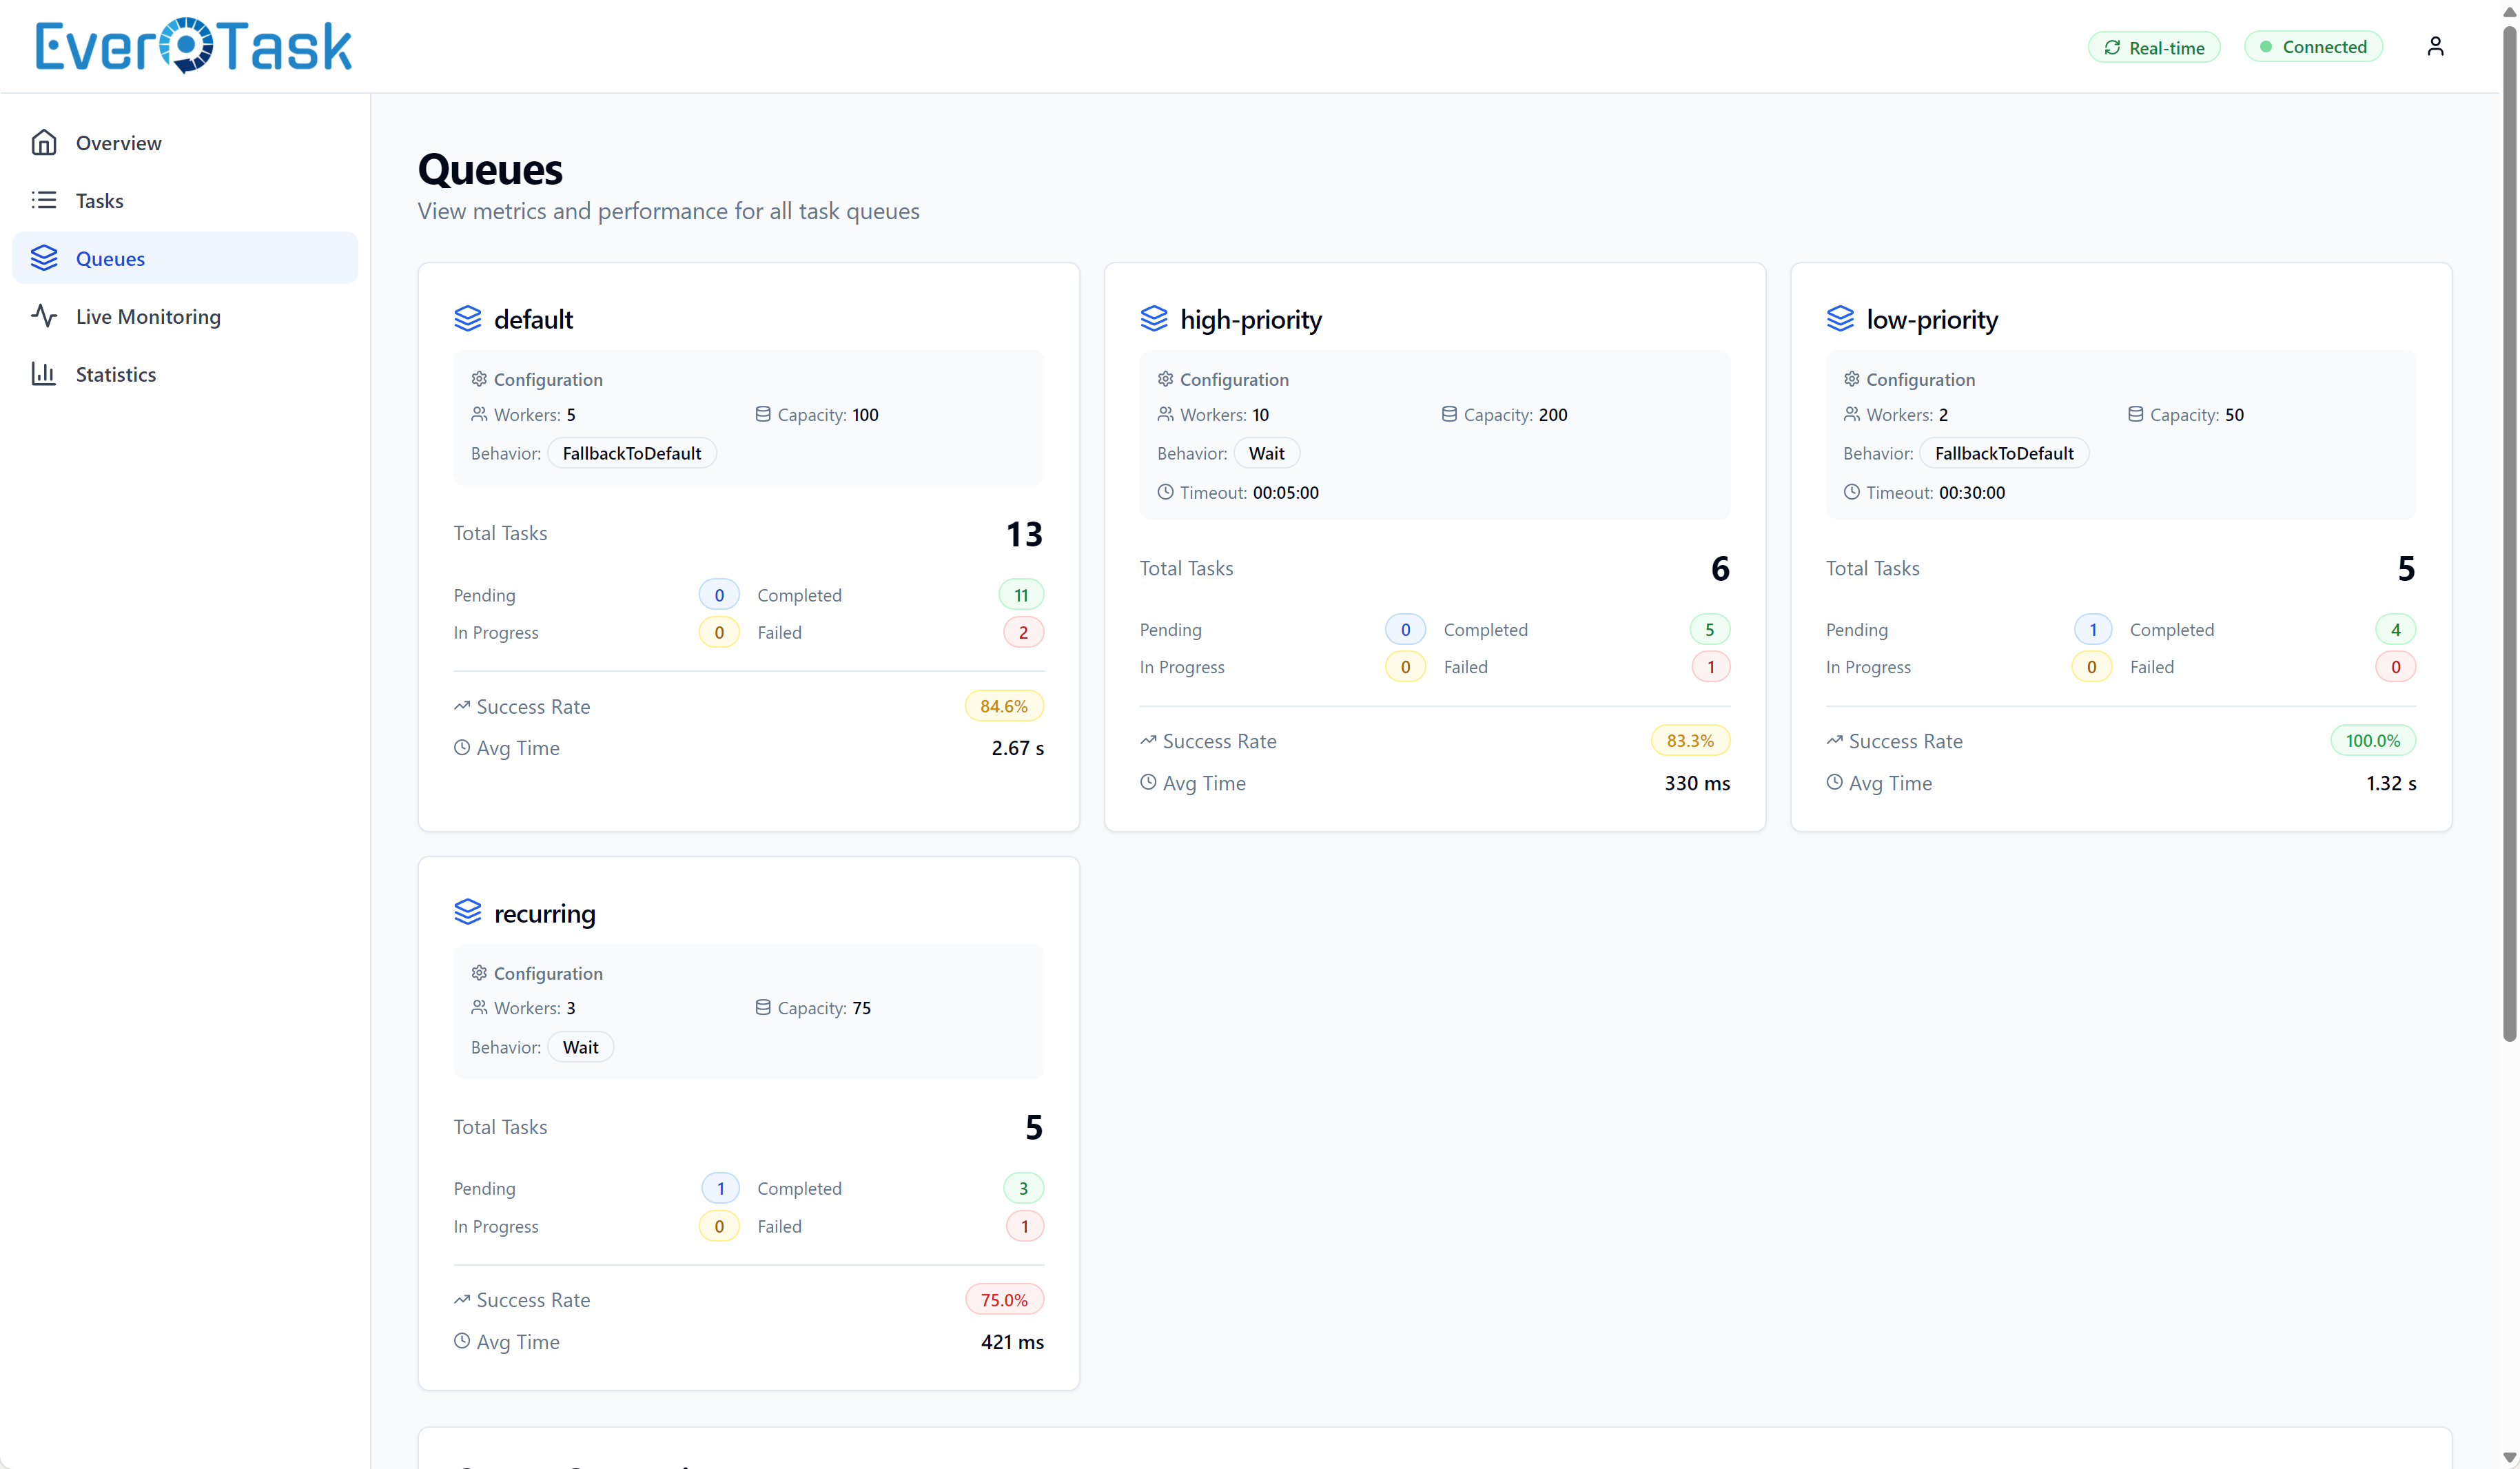
Multi-queue monitoring with success rates
Performance analytics and trends over time
Advanced filtering by status, queue, type, and date
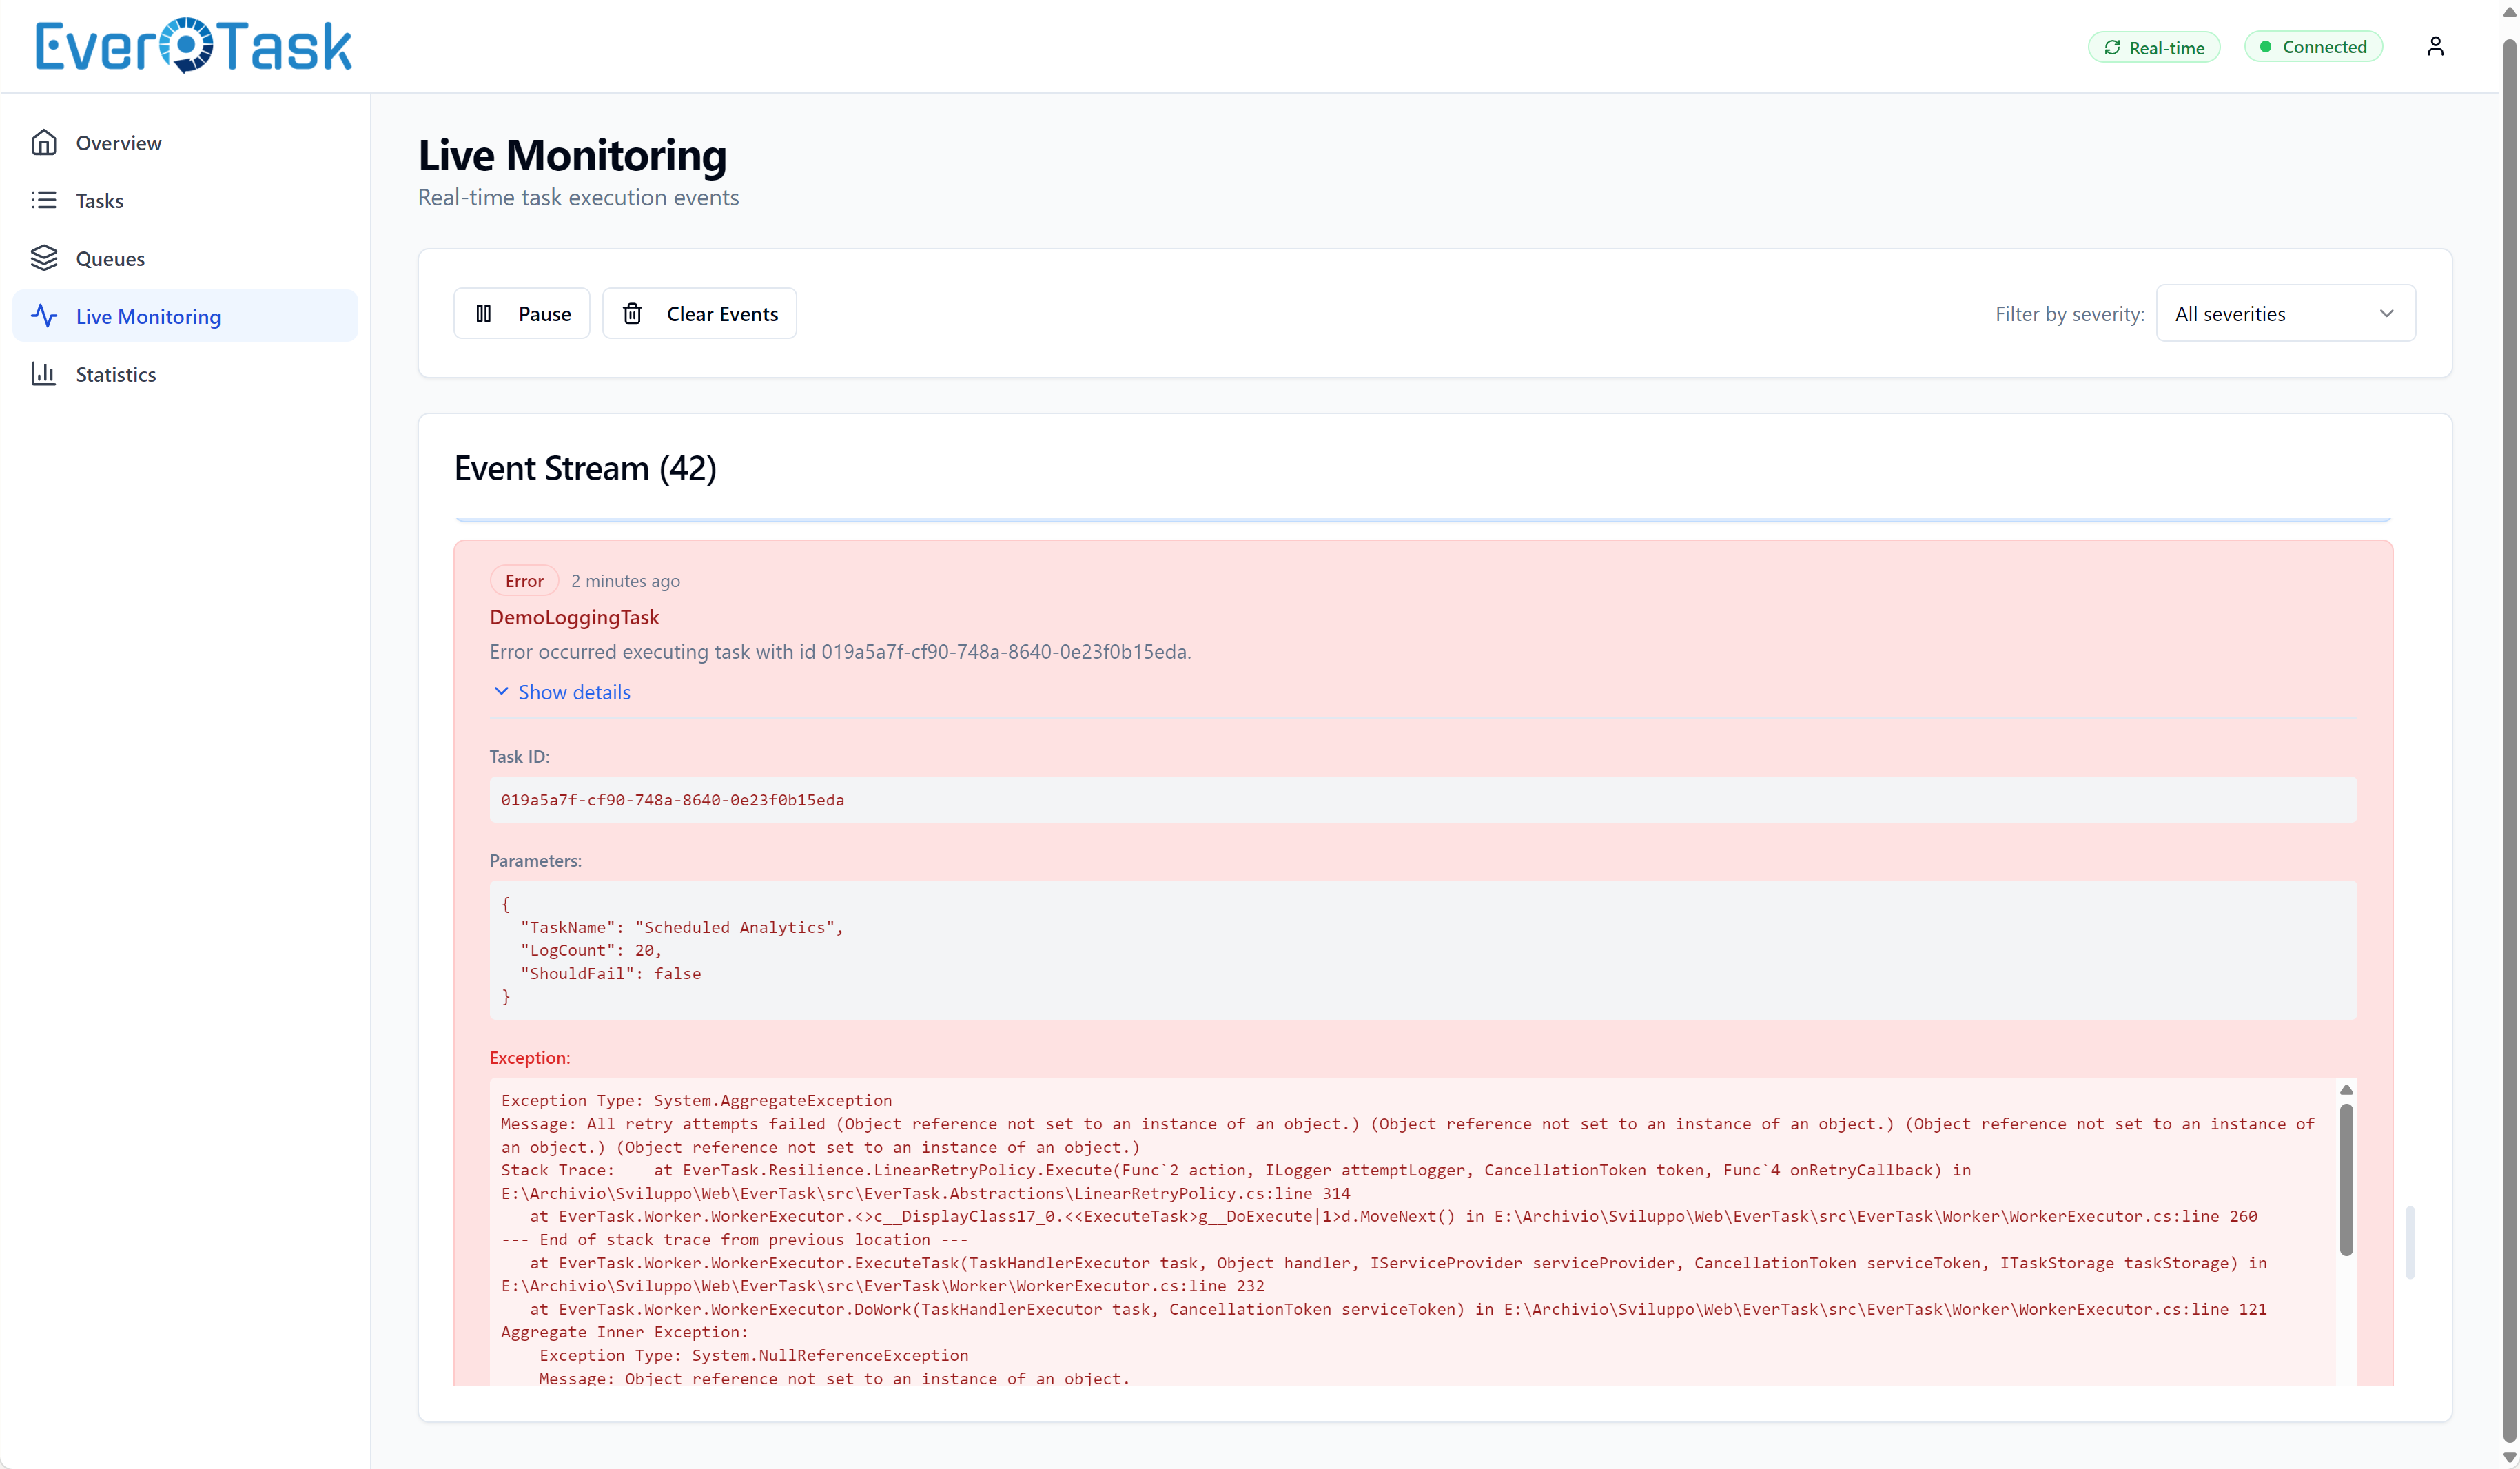
Live updates with SignalR integration
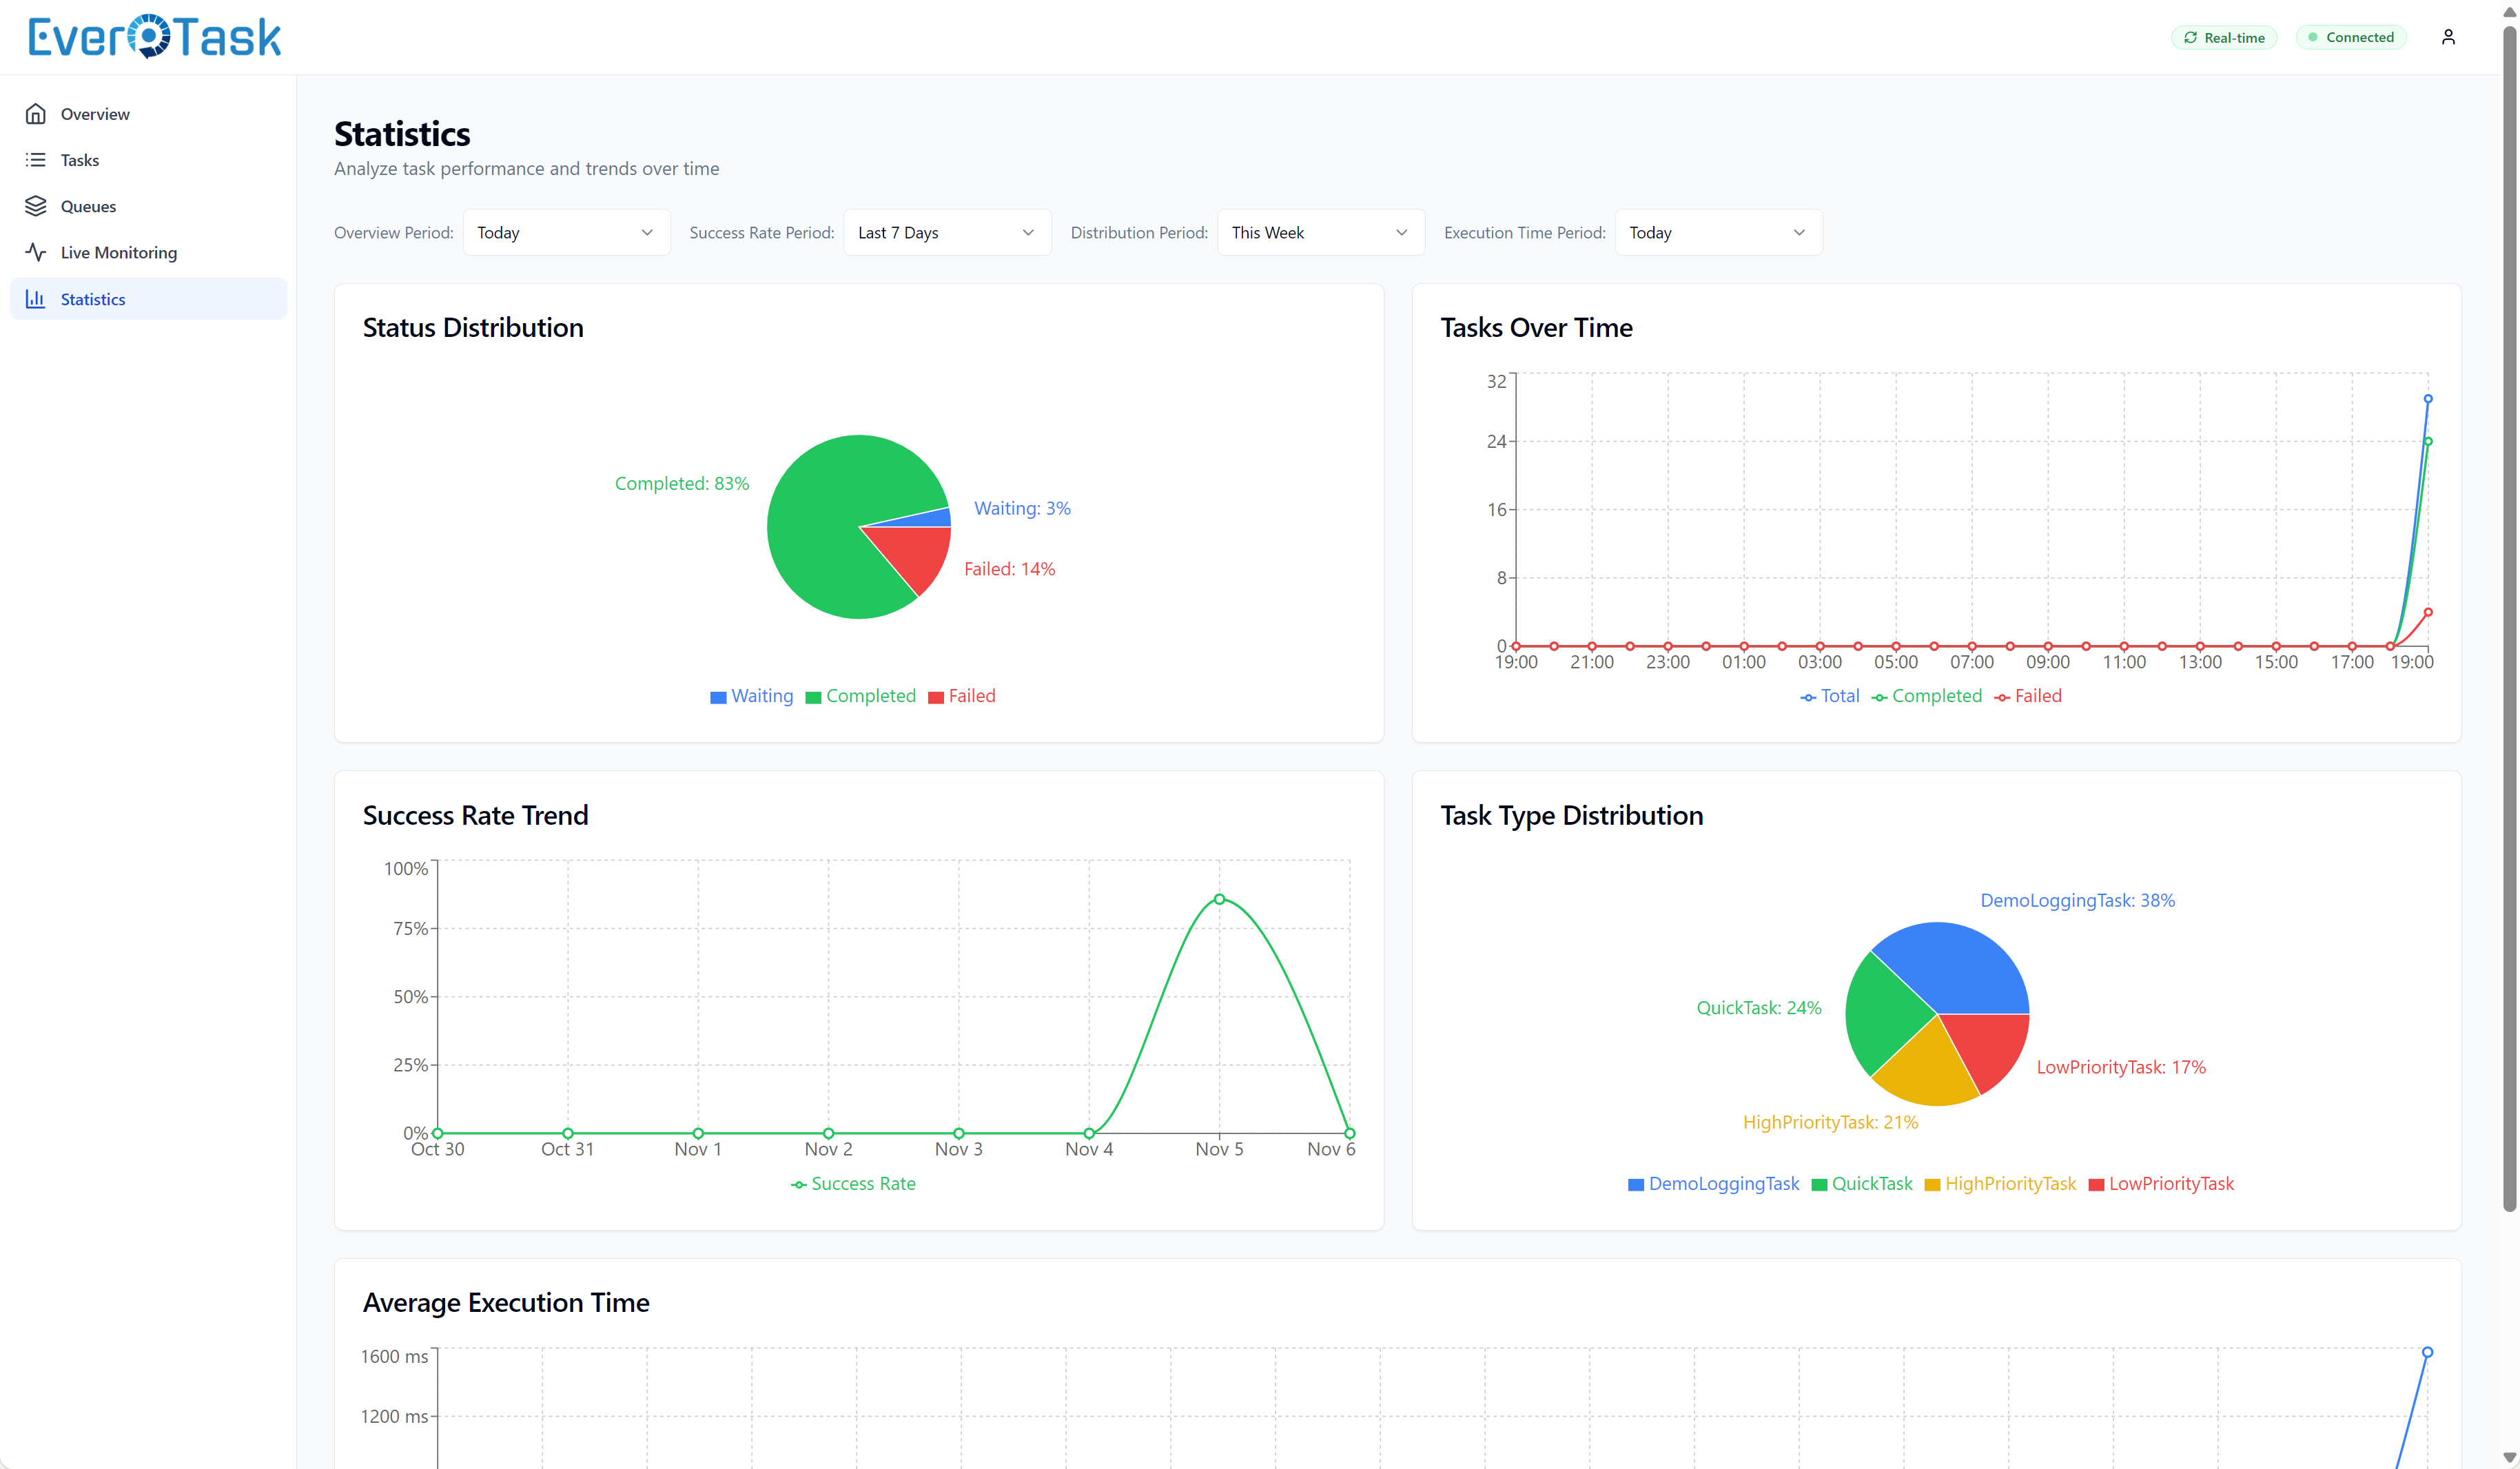
Execution history for recurring tasks
Coming in Future Releases
Write operations from the dashboard itself (requeue, resume, cancel, queue pause/resume) wait on an authorization model of their own: the dashboard’s single username and password is a read credential, and operations need a role that is not it. Until then those calls live in your application code, where the authorization already is.
Next Steps
- Monitoring Dashboard - Setup and configuration
- API Reference - REST API documentation
- Custom Event Monitoring - Event-based integrations
- Task Execution Logs - Log capture configuration