Monitoring Dashboard
A monitoring dashboard with a REST API and an embedded React UI for real-time task monitoring and analytics.
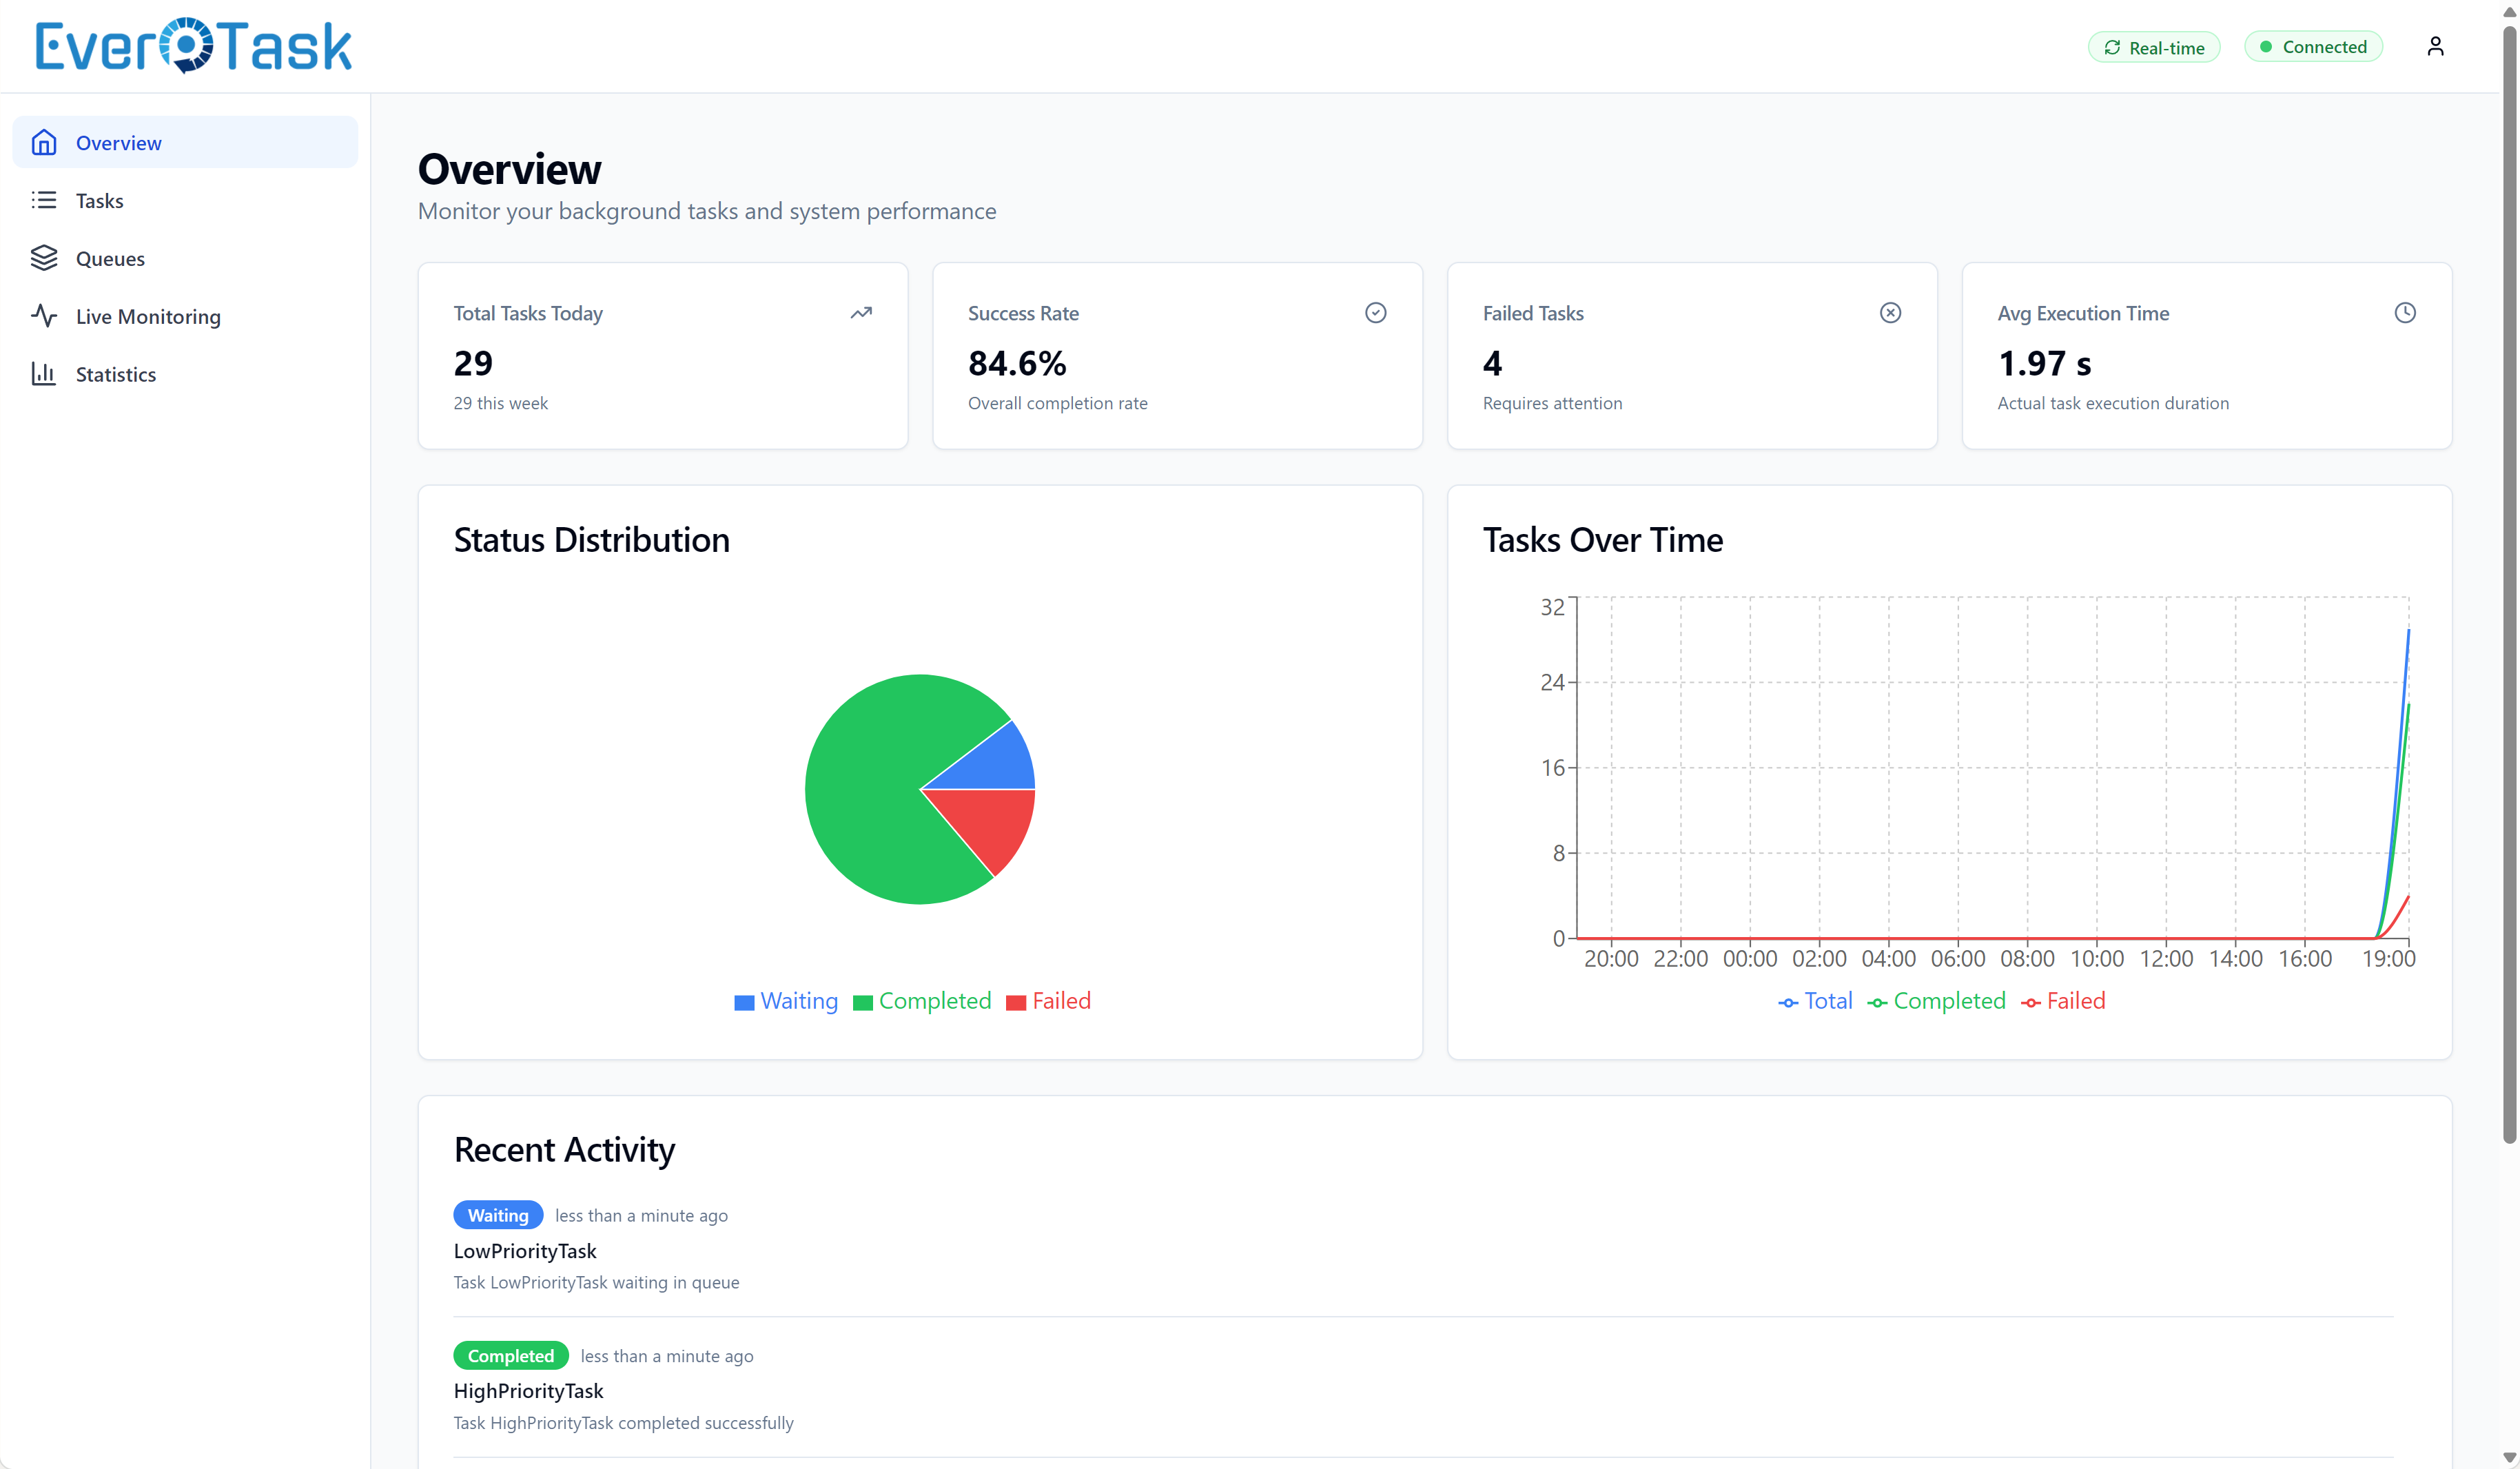
Table of Contents
- Overview
- Installation
- Quick Start
- Configuration
- Authentication
- Advanced Scenarios
- Swagger Integration
- Real-Time Monitoring
- Security Best Practices
- Integration Examples
- Documentation Resources
Overview
The EverTask Monitoring API provides:
- REST API for querying tasks, viewing statistics, and analyzing performance
- Embedded React Dashboard with modern UI for visual monitoring
- Real-Time Updates via SignalR integration with intelligent throttling
- Task History with detailed execution logs and status changes
- Analytics including success rate trends, execution times, and task distribution
- Queue Metrics for multi-queue monitoring
- JWT Authentication for secure access
The monitoring system can be used in two modes:
- Full Mode (default): API + embedded dashboard UI
- API-Only Mode: REST API only, for custom frontend integrations
Version 3.3 - Feature Complete (Read-Only Monitoring)
The dashboard and API are feature complete for read-only monitoring in version 3.3: observability and analytics over your task pipeline, without write operations.
Current Capabilities (v3.3):
- ✅ Complete read-only monitoring and observability
- ✅ Real-time task status updates via SignalR with event-driven cache invalidation
- ✅ Analytics (success rates, execution times, task distribution)
- ✅ Detailed execution logs visualization with filtering and export
- ✅ Multi-queue monitoring and advanced task filtering
- ✅ Audit trail visualization (status history, execution runs)
- ✅ Terminal-style log viewer with color-coded severity levels
Future Releases:
- ⏳ Task management operations (stop, restart, cancel running tasks)
- ⏳ Runtime parameter modification for queued/scheduled tasks
- ⏳ Queue management operations (pause/resume queues)
- ⏳ Task retry/requeue functionality
- ⏳ Bulk task operations
Note: Both the REST API and embedded dashboard currently operate in read-only mode. You can view, analyze, and export all task data, but cannot modify task execution or queue behavior through the UI or API. Task management capabilities will be introduced in future releases.
Installation
Install the monitoring API package:
dotnet add package EverTask.Monitor.Api
The package automatically includes:
- REST API controllers
- Embedded React dashboard
- SignalR monitoring integration
Quick Start
Add monitoring to your application with just a few lines of code:
using EverTask;
using EverTask.Monitor.Api.Extensions;

var builder = WebApplication.CreateBuilder(args);

// Configure EverTask with monitoring
builder.Services.AddEverTask(opt =>
{
    opt.RegisterTasksFromAssembly(typeof(Program).Assembly);
})
.AddSqlServerStorage(connectionString)
.AddMonitoringApi(options =>
{
    options.EnableUI = true;
    options.Username = "admin";
    options.Password = "admin";
    options.EnableAuthentication = true;
});

var app = builder.Build();

// Map monitoring endpoints
app.MapEverTaskApi();

app.Run();
Access the dashboard:
- Dashboard UI:
http://localhost:5000/evertask-monitoring - API Endpoints:
http://localhost:5000/evertask-monitoring/api - Credentials:
admin/admin
Configuration
EverTaskApiOptions
All configuration is done through the EverTaskApiOptions class passed to AddMonitoringApi():
.AddMonitoringApi(options =>
{
    // Base path for API and UI is fixed to "/evertask-monitoring"
    // options.BasePath is read-only

    // Enable/disable embedded dashboard (default: true)
    options.EnableUI = true;

    // JWT Authentication credentials
    options.Username = "admin";         // Default: "admin"
    options.Password = "admin";         // Default: "admin"

    // Authentication settings
    options.EnableAuthentication = true;          // Default: true

    // SignalR hub path for real-time updates (fixed path)
    // Note: SignalRHubPath is now fixed to "/evertask-monitoring/hub" and cannot be changed

    // Dashboard auto-refresh debounce (milliseconds)
    options.EventDebounceMs = 1000;                // Default: 1000 (1 second)

    // CORS settings
    options.EnableCors = true;                     // Default: true
    options.CorsAllowedOrigins = new[] {           // Default: empty (allow all)
        "https://myapp.com"
    };
});
Configuration Properties
| Property | Type | Default | Description |
|---|---|---|---|
EnableUI | bool | true | Enable embedded dashboard UI |
EnableSwagger | bool | false | Enable Swagger/OpenAPI documentation |
Username | string | "admin" | JWT authentication username |
Password | string | "admin" | JWT authentication password |
JwtSecret | string? | auto-generated | Secret key for signing JWT tokens (min 256 bits recommended) |
JwtIssuer | string | "EverTask.Monitor.Api" | JWT token issuer |
JwtAudience | string | "EverTask.Monitor.Api" | JWT token audience |
JwtExpirationHours | int | 8 | JWT token expiration time in hours |
EnableAuthentication | bool | true | Enable JWT authentication |
EnableCors | bool | true | Register the EverTaskMonitoringApi CORS policy. The policy is registered but not applied by the integration; call app.UseCors("EverTaskMonitoringApi") in your pipeline to activate it |
CorsAllowedOrigins | string[] | [] | CORS allowed origins (empty = allow all) |
AllowedIpAddresses | string[] | [] | IP whitelist (empty = allow all IPs). Supports IPv4/IPv6 and CIDR notation |
MagicLinkToken | string? | null | Static token for magic link access. If set, enables /api/auth/magic endpoint for instant authentication |
EventDebounceMs | int | 1000 | Debounce time in milliseconds for SignalR event-driven cache invalidation in the dashboard. Higher values reduce API load during task bursts but introduce slight UI update delays |
Authentication
The monitoring API uses JWT (JSON Web Token) authentication for secure access.
Default Credentials
Username: admin
Password: admin
Warning: Always change the default credentials in production!
Authentication Flow
- Login: POST credentials to
/evertask-monitoring/api/auth/loginto obtain a JWT token - Use Token: Include the token in the
Authorization: Bearer {token}header for all API requests - Token Expiration: Tokens expire after 8 hours by default (configurable via
JwtExpirationHours)
Configuration
.AddMonitoringApi(options =>
{
    // Enable authentication (default: true)
    options.EnableAuthentication = true;

    // Set custom credentials
    options.Username = "monitor_user";
    options.Password = "secure_password_123";

    // JWT configuration
    options.JwtSecret = "your-256-bit-secret-key-here";  // Auto-generated if not provided
    options.JwtExpirationHours = 8;                       // Default: 8 hours
    options.JwtIssuer = "MyApp";                          // Default: "EverTask.Monitor.Api"
    options.JwtAudience = "MyApp";                        // Default: "EverTask.Monitor.Api"
});
Environment Variables
Store credentials and secrets securely using environment variables:
.AddMonitoringApi(options =>
{
    options.Username = Environment.GetEnvironmentVariable("MONITOR_USERNAME") ?? "admin";
    options.Password = Environment.GetEnvironmentVariable("MONITOR_PASSWORD") ?? "admin";
    options.JwtSecret = Environment.GetEnvironmentVariable("JWT_SECRET");  // Auto-generated if null
});
# Set environment variables
export MONITOR_USERNAME=admin
export MONITOR_PASSWORD=my_secure_password
export JWT_SECRET=your-strong-random-secret-min-256-bits
Login Endpoint
POST to /evertask-monitoring/api/auth/login to obtain a JWT token:
Request:
{
  "username": "admin",
  "password": "admin"
}
Response:
{
  "token": "eyJhbGciOiJIUzI1NiIsInR5cCI6IkpXVCJ9...",
  "expiresAt": "2025-01-16T02:00:00Z",
  "username": "admin"
}
Using the Token
Include the token in the Authorization header for all API requests:
curl -H "Authorization: Bearer eyJhbGciOiJIUzI1NiIsInR5cCI6IkpXVCJ9..." \
     http://localhost:5000/evertask-monitoring/api/tasks
Disable Authentication
For development environments only:
.AddMonitoringApi(options =>
{
    options.EnableAuthentication = false;  // No authentication required
});
Magic Link Access
For external system integration (embedding in other dashboards, direct access from internal tools), you can configure a static magic link token that provides instant access without login:
.AddMonitoringApi(options =>
{
    options.EnableAuthentication = true;
    options.MagicLinkToken = "your-very-long-secret-token-here-min-32-chars";
});
Access URL:
https://your-server/evertask-monitoring/magic?token=your-very-long-secret-token-here-min-32-chars
When a user visits this URL, they’re automatically authenticated and redirected to the dashboard. The magic link generates a standard JWT session token, so all subsequent requests work normally.
Use cases:
- Embedding in internal dashboards or portals
- Bookmarking for quick access
- Integration with other monitoring systems
- Sharing access with team members without credential management
Security notes:
- Use a long, random token (32+ characters recommended)
- The token never expires - change it in configuration to revoke access
- Combine with IP whitelist (
AllowedIpAddresses) for additional security - Always use HTTPS in production
Generate a secure token:
# PowerShell
[Convert]::ToBase64String((1..32 | ForEach-Object { Get-Random -Maximum 256 }) -as [byte[]])
If MagicLinkToken is not configured, the endpoint returns 404 and the feature is disabled.
Advanced Scenarios
API-Only Mode
Disable the embedded UI to use only the REST API:
.AddMonitoringApi(options =>
{
    options.EnableUI = false;  // Disable embedded dashboard
});
This is useful when:
- Building a custom frontend
- Integrating with existing monitoring systems
- Mobile app integration
- Third-party dashboard integration
CORS Configuration
Configure CORS for custom frontend applications:
.AddMonitoringApi(options =>
{
    options.EnableCors = true;
    options.CorsAllowedOrigins = new[]
    {
        "https://myapp.com",
        "https://dashboard.myapp.com"
    };
});
Allow all origins (development only):
.AddMonitoringApi(options =>
{
    options.EnableCors = true;
    options.CorsAllowedOrigins = Array.Empty<string>();  // Allow all origins
});
Environment-Specific Configuration
Adjust configuration based on environment:
builder.Services.AddEverTask(opt =>
{
    opt.RegisterTasksFromAssembly(typeof(Program).Assembly);
})
.AddSqlServerStorage(connectionString)
.AddMonitoringApi(options =>
{
    options.EnableUI = true;

    if (builder.Environment.IsDevelopment())
    {
        // Development: Disable authentication
        options.EnableAuthentication = false;
        options.EnableCors = true;
        options.CorsAllowedOrigins = Array.Empty<string>();
    }
    else
    {
        // Production: Strict security
        options.EnableAuthentication = true;
        options.Username = Environment.GetEnvironmentVariable("MONITOR_USERNAME") ?? "admin";
        options.Password = Environment.GetEnvironmentVariable("MONITOR_PASSWORD") ?? throw new InvalidOperationException("MONITOR_PASSWORD not set");
        options.JwtSecret = Environment.GetEnvironmentVariable("JWT_SECRET") ?? throw new InvalidOperationException("JWT_SECRET not set");
        options.EnableCors = true;
        options.CorsAllowedOrigins = new[] { "https://myapp.com" };
    }
});
SignalR Hub Path
The SignalR hub path is fixed to /evertask-monitoring/hub and cannot be customized. This ensures consistent integration between the API and the embedded dashboard UI.
Standalone API Registration
Use the monitoring API without EverTask integration (for custom scenarios):
// In Program.cs
builder.Services.AddEverTaskMonitoringApiStandalone(options =>
{
    options.EnableUI = false;
});

// Note: You must register ITaskStorage manually
builder.Services.AddSingleton<ITaskStorage, MyCustomStorage>();
The standalone registration does not configure SignalR monitoring. AddSignalRMonitoring is only available on EverTaskServiceBuilder (the chain returned by AddEverTask), so a standalone API has no live event feed: dashboard data refreshes on poll rather than on push. To get live updates, register the API through AddEverTask(...).AddMonitoringApi(...), which wires up the SignalR monitor for you.
Swagger Integration
EverTask Monitoring API provides automatic Swagger/OpenAPI documentation generation with complete separation from your application’s API documentation.
Enable Swagger Documentation
Enable Swagger for the monitoring API in your configuration:
.AddMonitoringApi(options =>
{
    options.EnableUI = true;
    options.EnableSwagger = true;  // Enable separate Swagger document
    // ... other options
});
Configure SwaggerUI
Add both endpoints to your SwaggerUI configuration:
// Configure your application's Swagger document
builder.Services.AddSwaggerGen(c =>
{
    c.SwaggerDoc("v1", new() { Title = "My Application API", Version = "v1" });
});

// In the pipeline
app.UseSwaggerUI(c =>
{
    c.SwaggerEndpoint("/swagger/v1/swagger.json", "My Application API");
    c.SwaggerEndpoint("/swagger/evertask-monitoring/swagger.json", "EverTask Monitoring API");
});
How It Works
When EnableSwagger = true:
- EverTask creates a separate Swagger document at
/swagger/evertask-monitoring/swagger.json - The document includes only EverTask monitoring endpoints (
/evertask-monitoring/api/*) - Your application’s Swagger document (
v1) excludes EverTask endpoints automatically - No namespace filtering or custom predicates required in your application
Result: A dropdown appears in Swagger UI to switch between your application API and EverTask Monitoring API, with complete separation of endpoints.
Real-Time Monitoring
The dashboard integrates seamlessly with EverTask’s SignalR monitoring.
Automatic Configuration
SignalR monitoring is automatically configured when you add the monitoring API. The hub path is fixed to /evertask-monitoring/hub and cannot be changed.
If SignalR monitoring wasn’t previously registered, it’s added automatically.
Manual SignalR Configuration
If you want more control over SignalR settings:
builder.Services.AddEverTask(opt =>
{
    opt.RegisterTasksFromAssembly(typeof(Program).Assembly);
})
.AddSqlServerStorage(connectionString)
.AddSignalRMonitoring(opt =>
{
    opt.IncludeExecutionLogs = true;  // Include logs in SignalR events
})
.AddMonitoringApi();
SignalR Events
The dashboard receives real-time events for:
- Task Started: When a task begins execution
- Task Completed: When a task finishes successfully
- Task Failed: When a task fails
- Task Cancelled: When a task is cancelled
- Task Timeout: When a task exceeds its timeout
Custom SignalR Client
Connect to the SignalR hub from your own application:
With JWT Authentication (when EnableAuthentication = true):\
import * as signalR from '@microsoft/signalr';

// First, obtain JWT token via login
const loginResponse = await fetch('/evertask-monitoring/api/auth/login', {
    method: 'POST',
    headers: { 'Content-Type': 'application/json' },
    body: JSON.stringify({ username: 'admin', password: 'admin' })
});
const { token } = await loginResponse.json();

// Connect to SignalR hub with JWT token
const connection = new signalR.HubConnectionBuilder()
    .withUrl('/evertask-monitoring/hub', {
        accessTokenFactory: () => token  // Pass JWT token for authentication
    })
    .withAutomaticReconnect()
    .build();

connection.on('EverTaskEvent', (eventData) => {
    console.log('Task event:', eventData);
    // eventData contains: TaskId, EventDateUtc, Severity, TaskType, Message, etc.
});

await connection.start();
Without Authentication (when EnableAuthentication = false or IP whitelist only):
const connection = new signalR.HubConnectionBuilder()
    .withUrl('/evertask-monitoring/hub')
    .withAutomaticReconnect()
    .build();

connection.on('EverTaskEvent', (eventData) => {
    console.log('Task event:', eventData);
});

await connection.start();
Note: The embedded React dashboard automatically handles JWT authentication. This is only needed for custom client integrations.
Security Best Practices
1. Change Default Credentials
Always change the default username and password:
.AddMonitoringApi(options =>
{
    options.Username = "your_username";
    options.Password = "strong_password_here";
});
2. Use HTTPS in Production
Always use HTTPS for monitoring endpoints in production:
var app = builder.Build();

if (!app.Environment.IsDevelopment())
{
    app.UseHttpsRedirection();
}

app.MapEverTaskApi();
3. Restrict CORS Origins
Don’t allow all origins in production:
.AddMonitoringApi(options =>
{
    options.EnableCors = true;
    options.CorsAllowedOrigins = new[]
    {
        "https://app.example.com",
        "https://dashboard.example.com"
    };
});
4. Use Environment Variables
Never hardcode credentials:
.AddMonitoringApi(options =>
{
    options.Username = Environment.GetEnvironmentVariable("MONITOR_USERNAME")
        ?? throw new InvalidOperationException("MONITOR_USERNAME not set");
    options.Password = Environment.GetEnvironmentVariable("MONITOR_PASSWORD")
        ?? throw new InvalidOperationException("MONITOR_PASSWORD not set");
});
5. Configure IP Whitelist
Restrict access to specific IP addresses or CIDR ranges. This protects both the API and SignalR hub:
.AddMonitoringApi(options =>
{
    // Only allow access from specific IPs
    options.AllowedIpAddresses = new[]
    {
        "192.168.1.100",           // Specific IP
        "10.0.0.0/8",              // Private network (CIDR notation)
        "172.16.0.0/12",           // Another private range
        "::1"                      // IPv6 localhost
    };
});
Important notes:
- When
AllowedIpAddressesis empty (default), all IPs are allowed - Supports IPv4, IPv6, and CIDR notation (e.g.,
192.168.0.0/24) - Checks
X-Forwarded-Forheader first (reverse proxy scenarios) - Returns 403 Forbidden if IP is not in whitelist
- IP check happens before authentication (more efficient)
Reverse proxy example:
// If behind nginx/IIS, client IP comes from X-Forwarded-For header
options.AllowedIpAddresses = new[]
{
    "203.0.113.0/24"  // Allow only from specific public IP range
};
6. Limit Network Access
Use firewall rules or network policies to restrict access:
// In appsettings.json
{
  "Kestrel": {
    "Endpoints": {
      "Monitoring": {
        "Url": "http://localhost:5001",  // Only accessible locally
        "Protocols": "Http1"
      }
    }
  }
}
7. Disable in Production (Optional)
If monitoring is only needed for development:
if (builder.Environment.IsDevelopment())
{
    builder.Services.AddEverTask(opt => ...)
        .AddMonitoringApi();
}
8. Rate Limiting
Consider adding rate limiting to monitoring endpoints:
builder.Services.AddRateLimiter(options =>
{
    options.AddFixedWindowLimiter("monitoring", opt =>
    {
        opt.Window = TimeSpan.FromSeconds(10);
        opt.PermitLimit = 100;
    });
});

app.UseRateLimiter();
Integration Examples
Console Application
using EverTask;
using EverTask.Monitor.Api.Extensions;

var builder = WebApplication.CreateBuilder(args);

builder.Services.AddEverTask(opt =>
{
    opt.RegisterTasksFromAssembly(typeof(Program).Assembly);
})
.AddMemoryStorage()
.AddMonitoringApi(options =>
{
    options.Username = "admin";
    options.Password = "admin";
});

var app = builder.Build();
app.MapEverTaskApi();
await app.StartAsync();

Console.WriteLine("Dashboard: http://localhost:5000/evertask-monitoring");
Console.WriteLine("Credentials: admin / admin");

// Your application logic...
Console.ReadKey();
await app.StopAsync();
ASP.NET Core Web Application
var builder = WebApplication.CreateBuilder(args);

builder.Services.AddEverTask(opt =>
{
    opt.RegisterTasksFromAssembly(typeof(Program).Assembly);
})
.AddSqlServerStorage(builder.Configuration.GetConnectionString("EverTaskDb")!)
.AddMonitoringApi(options =>
{
    options.EnableAuthentication = !builder.Environment.IsDevelopment();
});

var app = builder.Build();

app.UseHttpsRedirection();
app.UseStaticFiles();
app.UseRouting();
app.UseAuthorization();

app.MapControllers();
app.MapEverTaskApi();  // Add monitoring endpoints

app.Run();
Worker Service
var builder = Host.CreateApplicationBuilder(args);

builder.Services.AddEverTask(opt =>
{
    opt.RegisterTasksFromAssembly(typeof(Program).Assembly);
})
.AddSqlServerStorage(builder.Configuration.GetConnectionString("EverTaskDb")!)
.AddMonitoringApi();

// Add web server for monitoring
builder.Services.Configure<HostOptions>(options =>
{
    options.BackgroundServiceExceptionBehavior = BackgroundServiceExceptionBehavior.Ignore;
});

builder.Services.AddSingleton<IHostedService>(sp =>
{
    var webApp = WebApplication.CreateBuilder().Build();
    webApp.MapEverTaskApi();
    return new WebHostingService(webApp);
});

var host = builder.Build();
host.Run();
Custom Frontend Integration
Use the REST API with your own frontend:
// TypeScript example
import axios from 'axios';

const API_BASE = 'http://localhost:5000/evertask-monitoring/api';

// Login to get JWT token
const loginResponse = await axios.post(`${API_BASE}/auth/login`, {
    username: 'admin',
    password: 'admin'
});

const token = loginResponse.data.token;
console.log('Token expires at:', loginResponse.data.expiresAt);

// Create axios instance with JWT token
const api = axios.create({
    baseURL: API_BASE,
    headers: {
        'Authorization': `Bearer ${token}`
    }
});

// Get tasks
const response = await api.get('/tasks', {
    params: {
        status: 'Completed',
        page: 1,
        pageSize: 20
    }
});

console.log('Tasks:', response.data.tasks);
console.log('Total:', response.data.totalCount);

// Get task details
const task = await api.get(`/tasks/${taskId}`);
console.log('Task:', task.data);

// Get dashboard overview
const overview = await api.get('/dashboard/overview', {
    params: { range: 'Today' }
});

console.log('Total tasks:', overview.data.totalTasks);
console.log('Success rate:', overview.data.successRate);
Documentation Resources
The monitoring documentation is organized into specialized guides:
📊 API Reference
Complete REST API documentation with all endpoints:
- Tasks endpoints (list, details, history)
- Dashboard endpoints (overview, activity)
- Queue endpoints (metrics, health)
- Statistics endpoints (trends, analytics)
- Request/response examples and query parameters
🎨 Dashboard UI Guide
Visual interface documentation with screenshots:
- Overview page (metrics, charts, activity feed)
- Task list view (filtering, sorting, pagination)
- Task detail view (parameters, history, logs)
- Queue metrics (distribution, success rates)
- Statistics & analytics (trends, performance)
- Complete screenshot gallery
🔌 Custom Event Monitoring
Build custom integrations using the event system:
- Task lifecycle events
- DIY SignalR integration
- Third-party monitoring (Application Insights, Prometheus)
- Custom alerts (Slack, email, PagerDuty)
- Serilog integration
Next Steps
- API Reference - Complete REST API documentation
- Dashboard UI Guide - UI features and screenshots
- Custom Event Monitoring - Event-based monitoring and custom integrations
- Configuration Reference - All configuration options
- Architecture - How monitoring works internally